Integrate via Cloudflare Dashboard
Installation
Prerequisites
DATADOME_SERVER_SIDE_KEYavailable in your DataDome dashboard,DATADOME_CLIENT_SIDE_KEYavailable in your DataDome dashboard.
Protect your traffic
- Connect to your Cloudflare Dashboard and go to the Workers & Pages section.
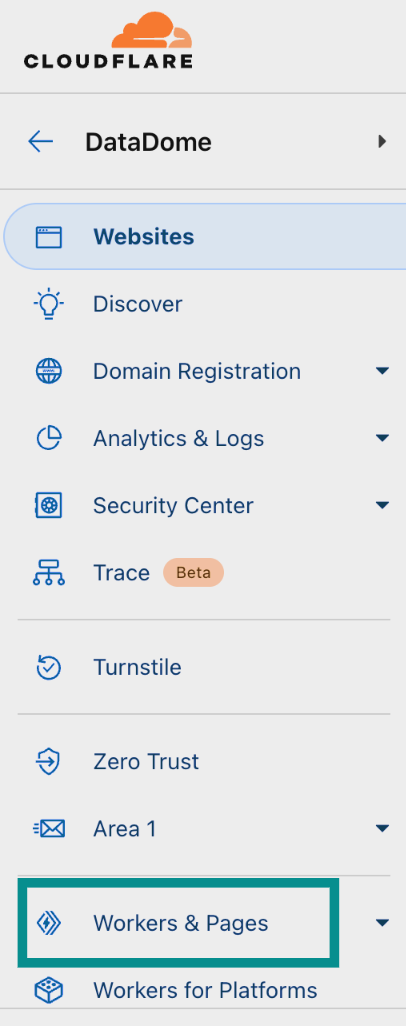
Cloudflare Dashboard tab.
- Click on Create.
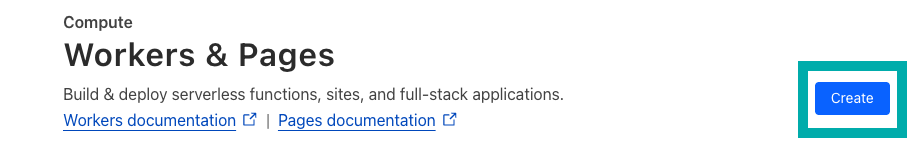
Create application.
- Click on Get started for Start with Hello World!.

Create Worker.
- Choose a name for the Worker, for example
worker/datadome.jsand click on Deploy.
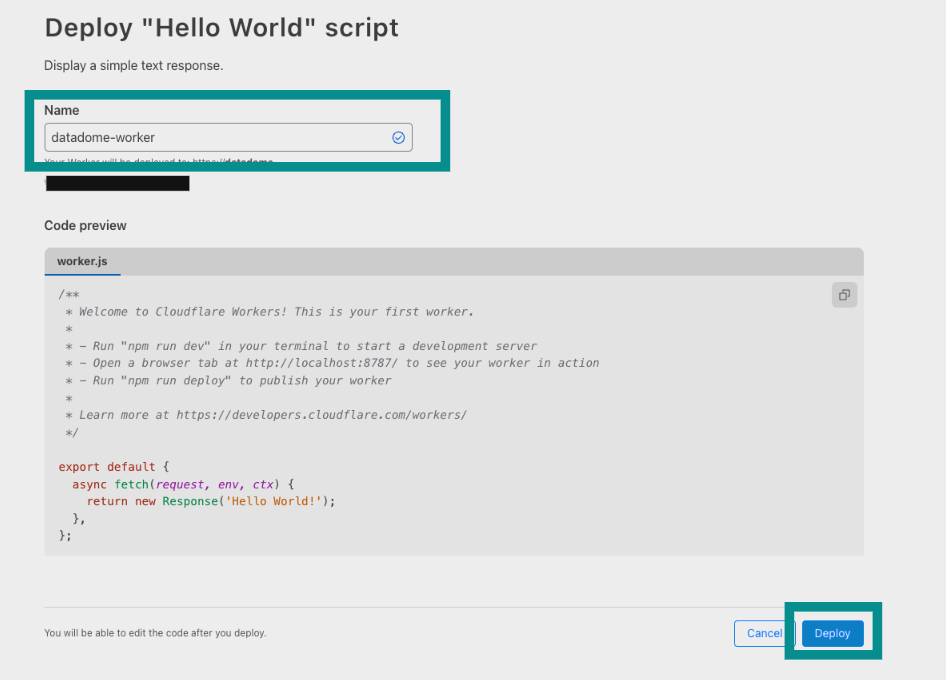
Name Worker.
- After your DataDome Worker has been deployed, click on Continue to project.
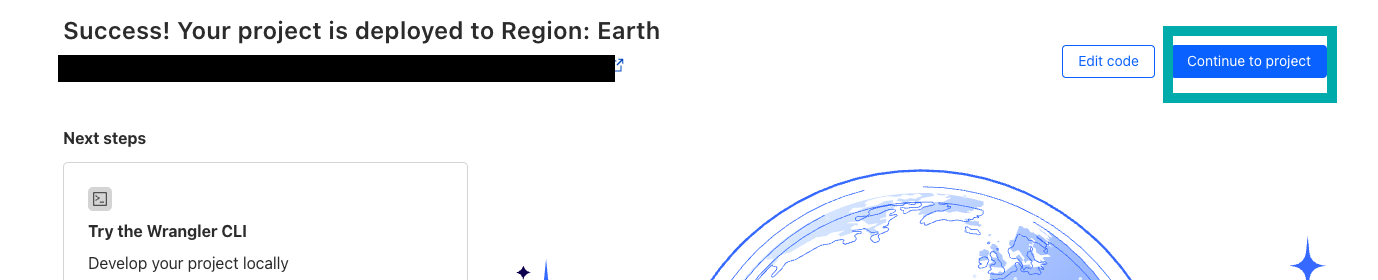
Configure Worker.
- In the Settings tab, inside the Variables and Secrets panel, click on Add .
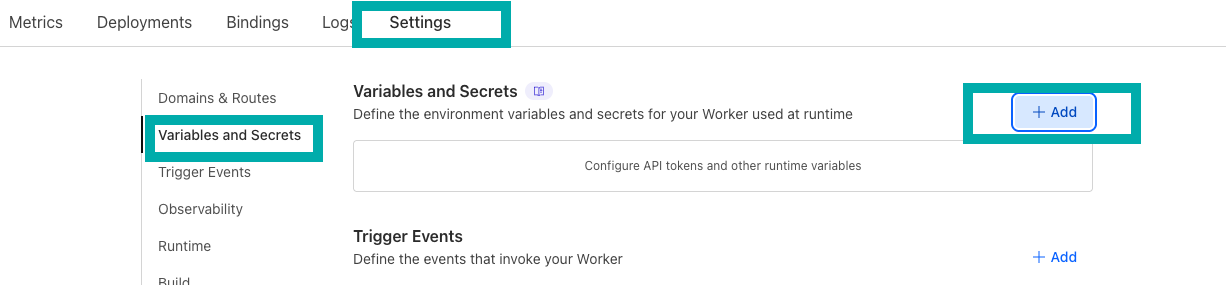
Add variables in Settings.
- Select the type Secret .
- Enter the variable name
DATADOME_SERVER_SIDE_KEYand set the value that is available in your DataDome dashboard. - Click on Deploy.
- Click on Add again.
- Select the type Secret.
- Enter the variable name
DATADOME_CLIENT_SIDE_KEYand set the value that is available in your DataDome dashboard. - Click on Deploy.
- Click on the Edit code icon at the top of the page.

Quick edit Worker.
- Download the latest version of our Cloudflare Worker script.
- Delete the Hello World template and paste the code from
dist/datadome.jsin the Script Editor. - Click on Deploy.

Save and deploy Worker's script.
- Go back to the Worker overview and click on Settings.
- Inside the Domains & Routes section, click on Add
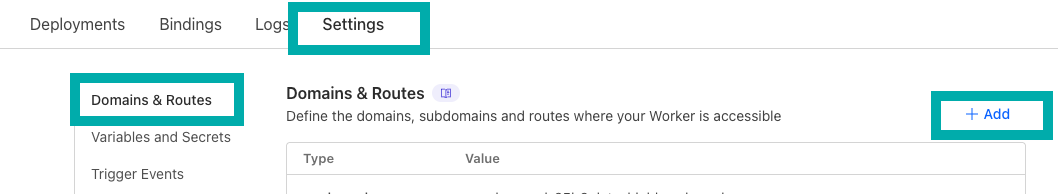
Configure domains and routes.
- Refer to Cloudflare documentation on Domains and Routes to trigger the DataDome Worker on the pages you want to protect.
- Congrats! You can now see your traffic in your DataDome dashboard.
Configuration
The configuration is done inside the script, using constants.
Server-side settings
| Setting name in Worker's code | Environment variable type | Description | Required | Default value | Example |
|---|---|---|---|---|---|
| DATADOME_SERVER_SIDE_KEY | Secret | Your DataDome server-side key, found in your dashboard. | Yes | - | - |
| DATADOME_TIMEOUT | Text | Request timeout to DataDome API, in milliseconds. | No | 300 | 350 |
| DATADOME_URL_REGEX_EXCLUSION | Text | Regular expression to exclude URLs from the DataDome analysis. | No | List of excluded static assets below | - |
| DATADOME_URL_REGEX_INCLUSION | Text | Regular expression to only include URLs in the DataDome analysed traffic. | No | - | /login*/i |
| DATADOME_IP_EXCLUSION | Text | List of IPs or CIDR from which traffic will be excluded from the DataDome analysis. | No | - | ["192.168.0.1", "192.168.0.2", "192.168.0.0/24"] |
| DATADOME_LOGPUSH_CONFIGURATION | Text | List of Enriched headers names to log inside Logpush. | No | - | ["X-DataDome-botname", "X-DataDome-captchapassed", "X-DataDome-isbot"] |
| DATADOME_ENABLE_GRAPHQL_SUPPORT | Text | Extract GraphQL operation name and type on request to a /graphql endpoint to improve protection. | No | false | true |
| DATADOME_ENABLE_REFERRER_RESTORATION | Text | Set to true to restore original referrer when a challenge is passed. | No | false | true |
| DATADOME_ENABLE_DEBUGGING | Text | Log in Workers logs detailed information about the DataDome process. | No | false | true |
| DATADOME_ENABLE_MCP_SUPPORT | Text | Boolean to enable Model Context Protocol support. | No | false | true |
| DATADOME_CUSTOM_FIELD_STRING_1 | Text | Static value or callback function to send a custom string. Refer to Add custom field section. | No | - | |
| DATADOME_CUSTOM_FIELD_STRING_2 | Text | Static value or callback function to send a custom string. Refer to Add custom field section. | No | - | |
| DATADOME_CUSTOM_FIELD_STRING_3 | Text | Static value or callback function to send a custom string. Refer to Add custom field section. | No | - | |
| DATADOME_CUSTOM_FIELD_INTEGER_1 | Text | Static value or callback function to send a custom integer. Refer to Add custom field section. | No | - | |
| DATADOME_CUSTOM_FIELD_INTEGER_2 | Text | Static value or callback function to send a custom integer. Refer to Add custom field section. | No | - | |
| DATADOME_CUSTOM_FIELD_FLOAT_1 | Text | Static value or callback function to send a custom float. Refer to Add custom field section. | No | - | |
| DATADOME_USER_ID | Text | Static value or callback function to send a custom value representing a user ID. Refer to Add custom field section. | No | - | |
| DATADOME_PRODUCT_ID | Text | Static value or callback function to send a custom value representing a product ID. Refer to Add custom field section. | No | - |
/\.(avi|flv|mka|mkv|mov|mp4|mpeg|mpg|mp3|flac|ogg|ogm|opus|wav|webm|webp|bmp|gif|ico|jpeg|jpg|png|svg|svgz|swf|eot|otf|ttf|woff|woff2|css|less|js|map)$/iClient-side settings
| Setting name in Worker's code | Environment variable type | Description | Required | Default value | Example |
|---|---|---|---|---|---|
| DATADOME_CLIENT_SIDE_KEY | Secret | Your DataDome client-side key, found in your dashboard. | Yes | - | - |
| DATADOME_JS_URL | Text | URL of the DataDome JS tag that can be changed to include the tag as a first party. | No | https://js.datadome.co/tags.js | https://ddfoo.com/tags.js |
| DATADOME_JS_ENDPOINT | Text | Endpoint of the DataDome JS Tag. | No | ||
| DATADOME_JS_TAG_OPTIONS | Text | JSON object describing DataDome JS Tag options. | No | { "ajaxListenerPath": true } | { "ajaxListenerPath": "example.com", "allowHtmlContentTypeOnCaptcha": true } |
| DATADOME_JS_URL_REGEX_EXCLUSION | Text | Regular expression to NOT set the DataDome JS Tag on matching URLs. | No | - | - |
| DATADOME_JS_URL_REGEX_INCLUSION | Text | Regular expression to set the DataDome JS Tag on matching URLs. | No | - | /login*/i |
Update from the Dashboard
- Download the latest version of our Cloudflare Worker script.
- Go to your DataDome Worker Overview.
- Click on Quick edit.

Quick edit Worker.
- Retrieve the specific values that you may have set to configure your DataDome Worker that are not the default value.
- Update the script with the new content of
dist/datadome.js. - Configure the settings with the values from step 4.
- Deploy your Worker.
terraform applyUninstallation from the Dashboard
To uninstall DataDome, delete the DataDome Worker.
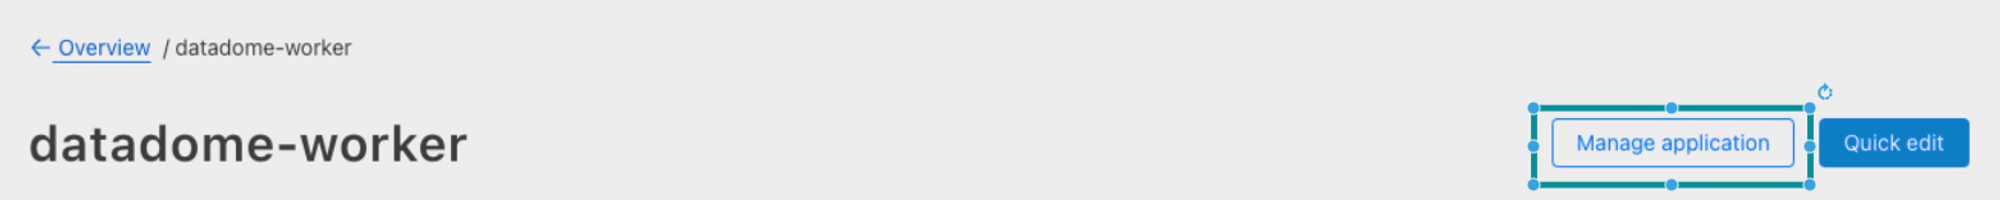
- Go to the DataDome Worker overview and click on Manage application.
- Click on Delete.
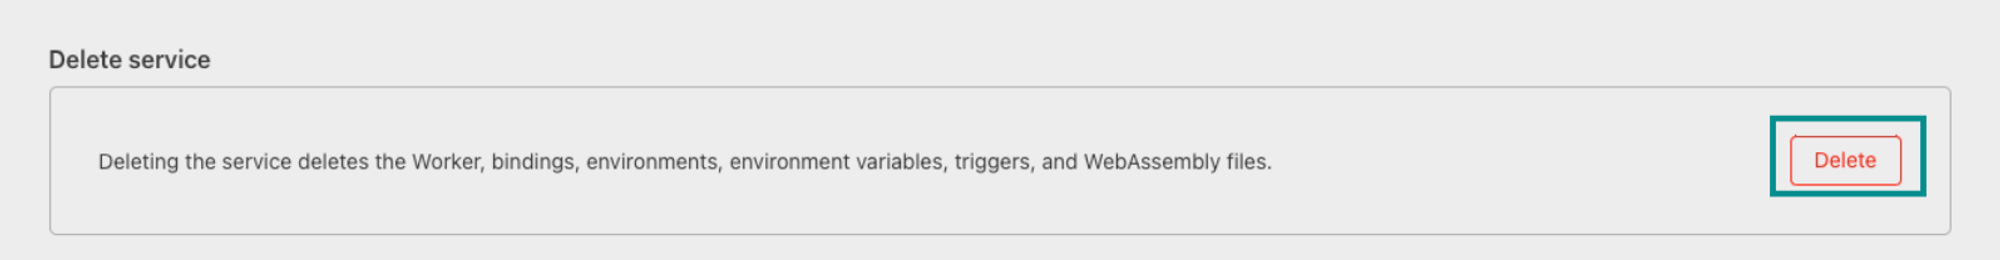
- Confirm the deletion.
Logging
DataDome custom logging
- Inside the Cloudflare Dashboard, go to the DataDome Worker's page.
- Click onSettings, go to the Observability section.
- Click on the pen icon next to Workers Logs.
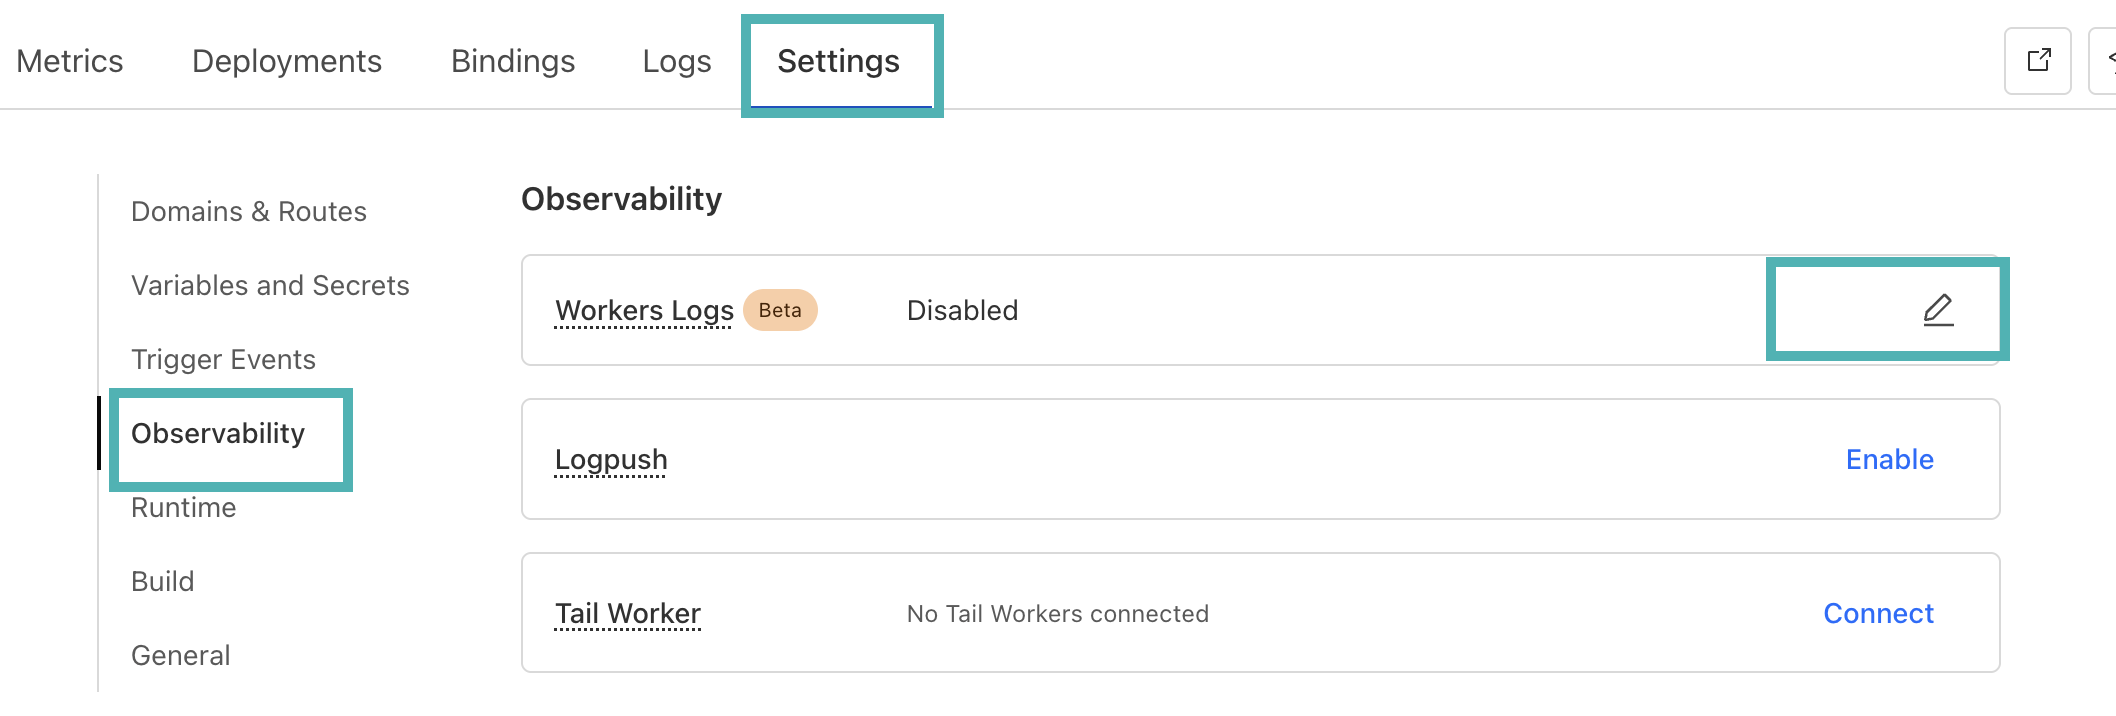
- Enable logs.
- Click on Deploy.
- You will see the logs inside the Logs tab.
By default, DataDome logs errors only (such as errors in the configuration). If you want to have detailed logs for debugging, you can setDATADOME_ENABLE_DEBUGGINGtotrue.
DataDome logs format
The DataDome custom logs have the following format:
{
  "step": "string",
  "result": "string",
  "reason": "string",
  "details": {
    "key": "value"
  },
  "company": "DataDome",
  "line": 123
}
Logpush
You can use Logpush to send logs to a destination supported by Logpush (Datadog, Splunk, S3 Bucket…).
Cloudflare planLogpush is available to customers on Cloudflare’s Enterprise plan.
Update the Worker’s script
- Fill the
DATADOME_LOGPUSH_CONFIGURATIONvalue with the name of the values you want, as an Array of Strings.
The possible values are available in the Enriched headers page.
Enable Logpush
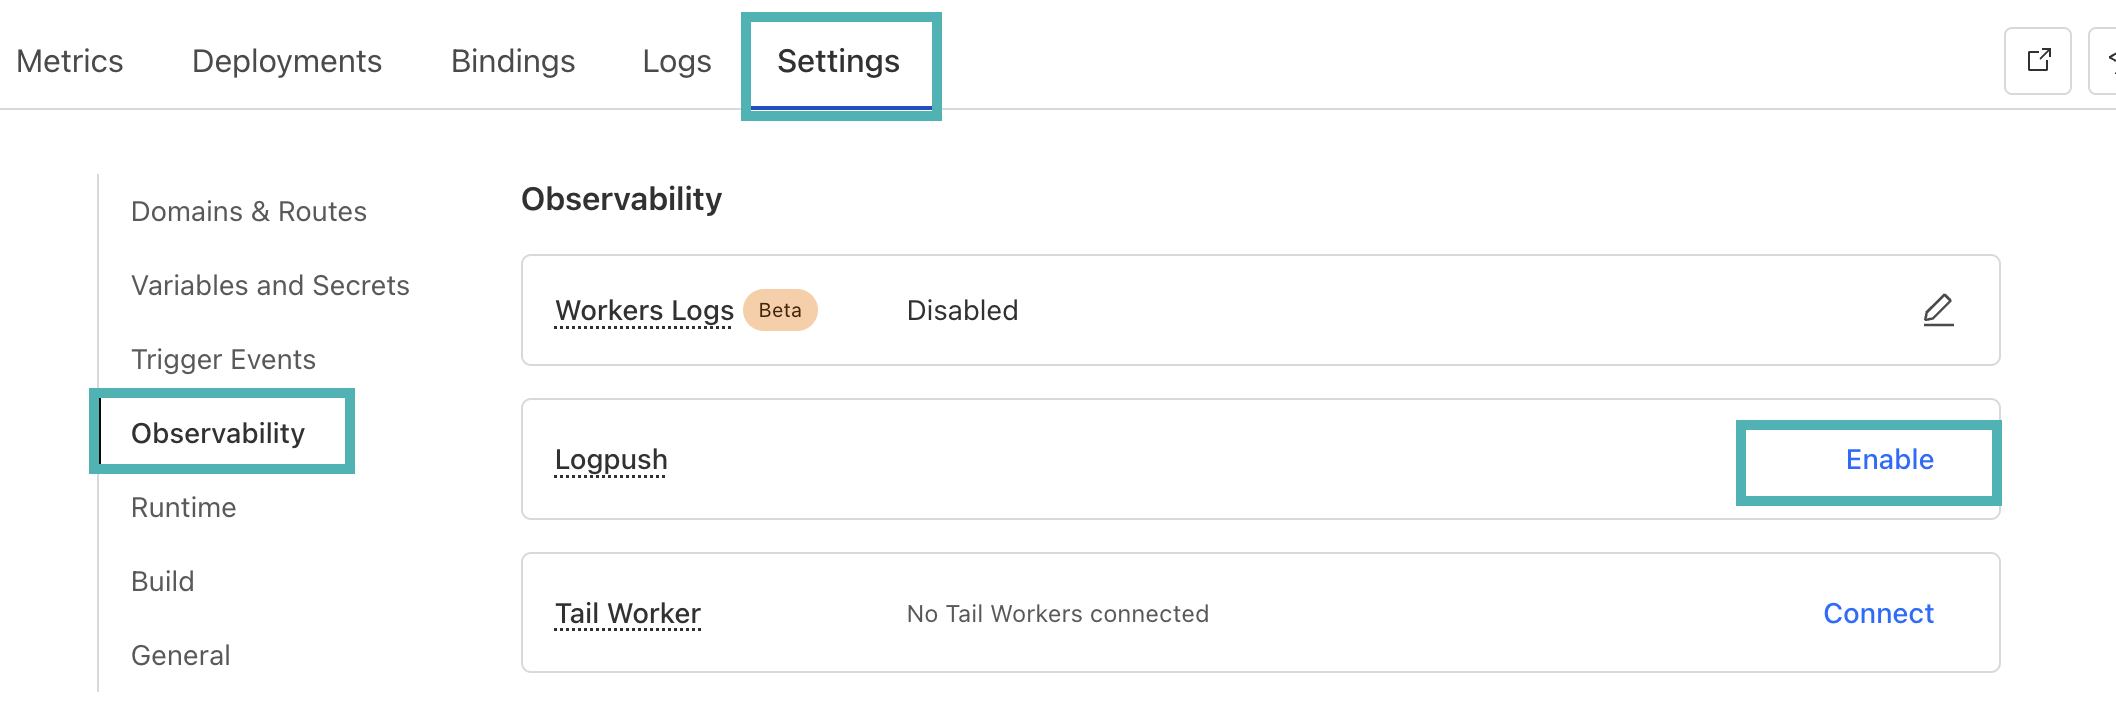
- Inside the Cloudflare Dashboard, go to the DataDome Worker's page.
- Click onSettings, go to the Observability section.
- Click on Enable next to Logpush.
Advanced configuration
Add custom fields
Requires version 2.2.0 of the CloudflareWorker module.
Custom fields featureDataDome let you enrich in real time our detection engine by sending us some custom fields with your business data. These fields can be used for specific detection models.
👋 Please reach out to our support team for reviewing the data received.
Sample a callback function to set custom fields dynamically
The callback is a function receiving a single parameter, the Cloudflare Http request - defined here:
// Sample code for custom fields
// Editing directly the datadome.js file
let DATADOME_CUSTOM_FIELD_STRING_1 = function (request) {
    if (request.headers.has('x-user-tier')) {
        return request.headers.get('x-user-tier');
    } else {
        return 'standard';
    }
};
// Sample code for custom fields
// when calling activateDataDome
const dataDomeHandler = activateDataDome(myHandler, {
serverSideKey: env.DATADOME_SERVER_SIDE_KEY,
clientSideKey: env.DATADOME_CLIENT_SIDE_KEY,
customFieldString1: function (request) {
if (request.headers.has('x-user-tier')) {
return request.headers.get('x-user-tier');
} else {
return 'standard';
}
},
// ...other options
});
Restore the referrer
After passing a DataDome challenge on browsers other than Firefox, the referrer value is updated to the current URL which can lead to inconsistent results in website analytics.
It is possible to restore the Referer header to its original value for your backend:
- Contact our support team, they will review your requirements and provide you with the best recommendations
- Set the boolean value of the
DATADOME_ENABLE_REFERRER_RESTORATIONoption totrue
Enable GraphQL support
It is possible to enable GraphQL support and extract the operation type and operation name from the request body from GraphQL requests.
You need to set the boolean value of the DATADOME_ENABLE_GRAPHQL_SUPPORT option to true
Once enabled, POST requests targeting a graphql endpoint with content-type: application/json will be analyzed to extract GraphQL operation name and type.
Enable MCP support
Starting from version 2.3.0 of the module, it is possible to enable support for the Model Context Protocol and extract information from the request body.
You need to set the boolean value of DATADOME_ENABLE_MCP_SUPPORT option to true.
Once enabled, requests targeting an endpoint with a /mcp route will be analyzed to extract MCP properties according to the official specification:
mcp-session-idandmcp-protocol-versionheadersjsonRpcVersion,jsonRpcRequestId, andmcpMethodrequest body fieldsmcpParamsClientInfoNameandmcpParamsClientInfoVersionrequest body fields when the method isinitializemcpParamsToolNamerequest body field when the method istools/call
Updated 5 months ago