Explore your data
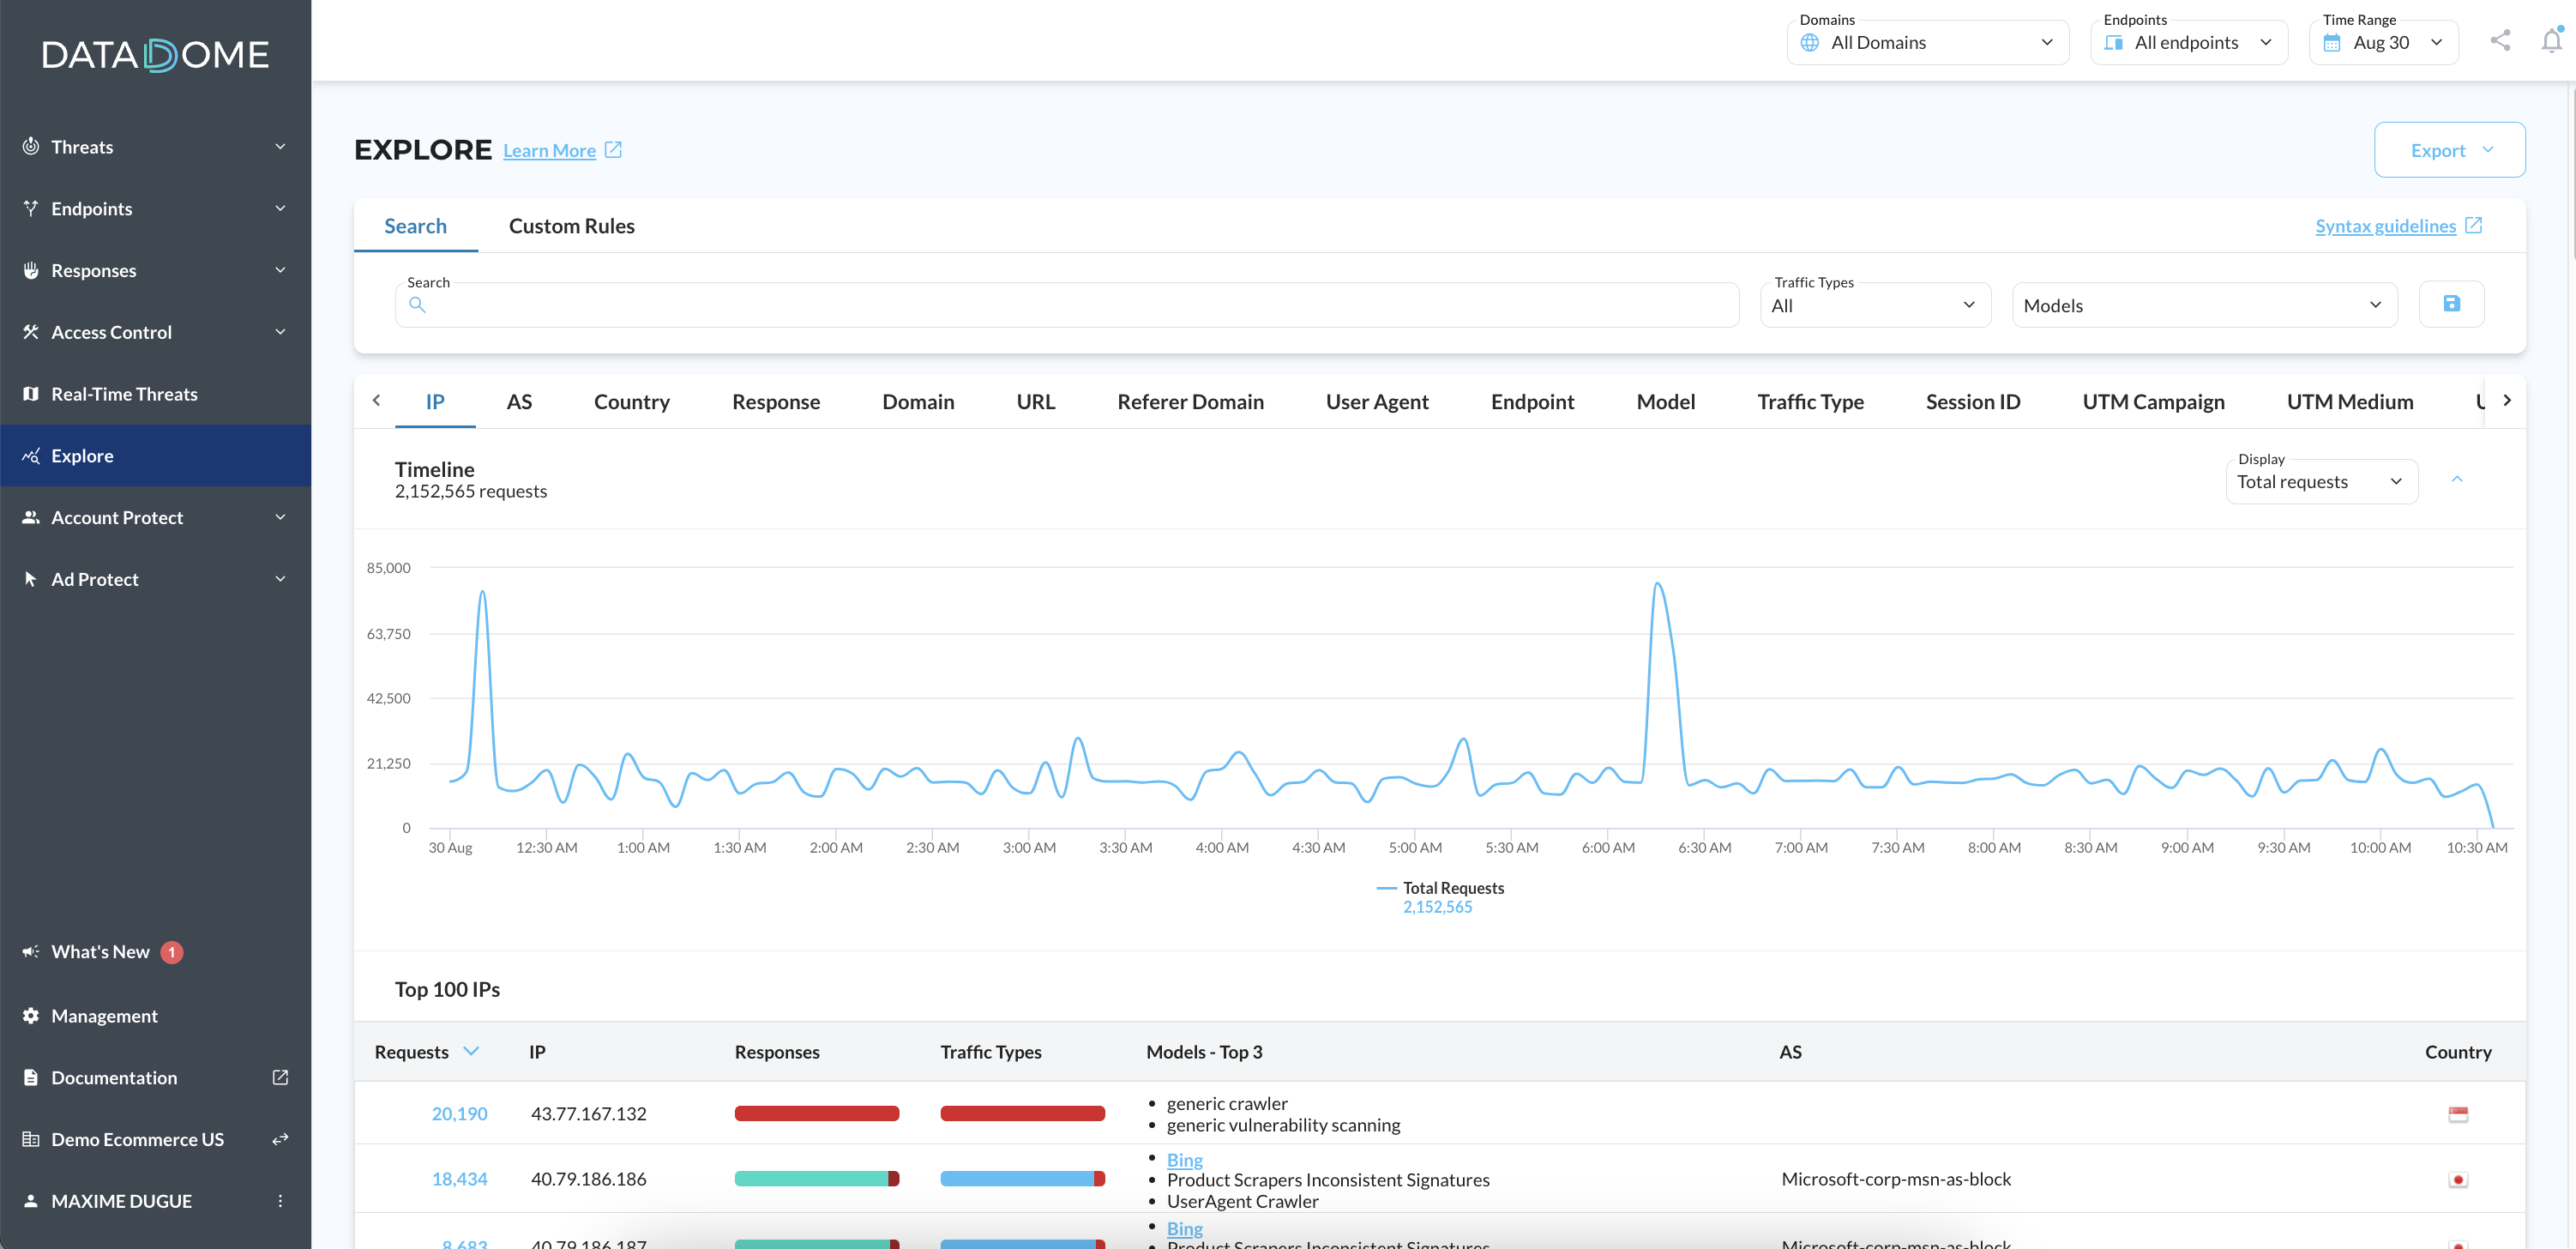
The "Explore" view allows you to dig deep inside your data.
Plan restrictionFor all dimensions, you can check the activity for the last 30 days (when you have subscribed to a Corporate plan).
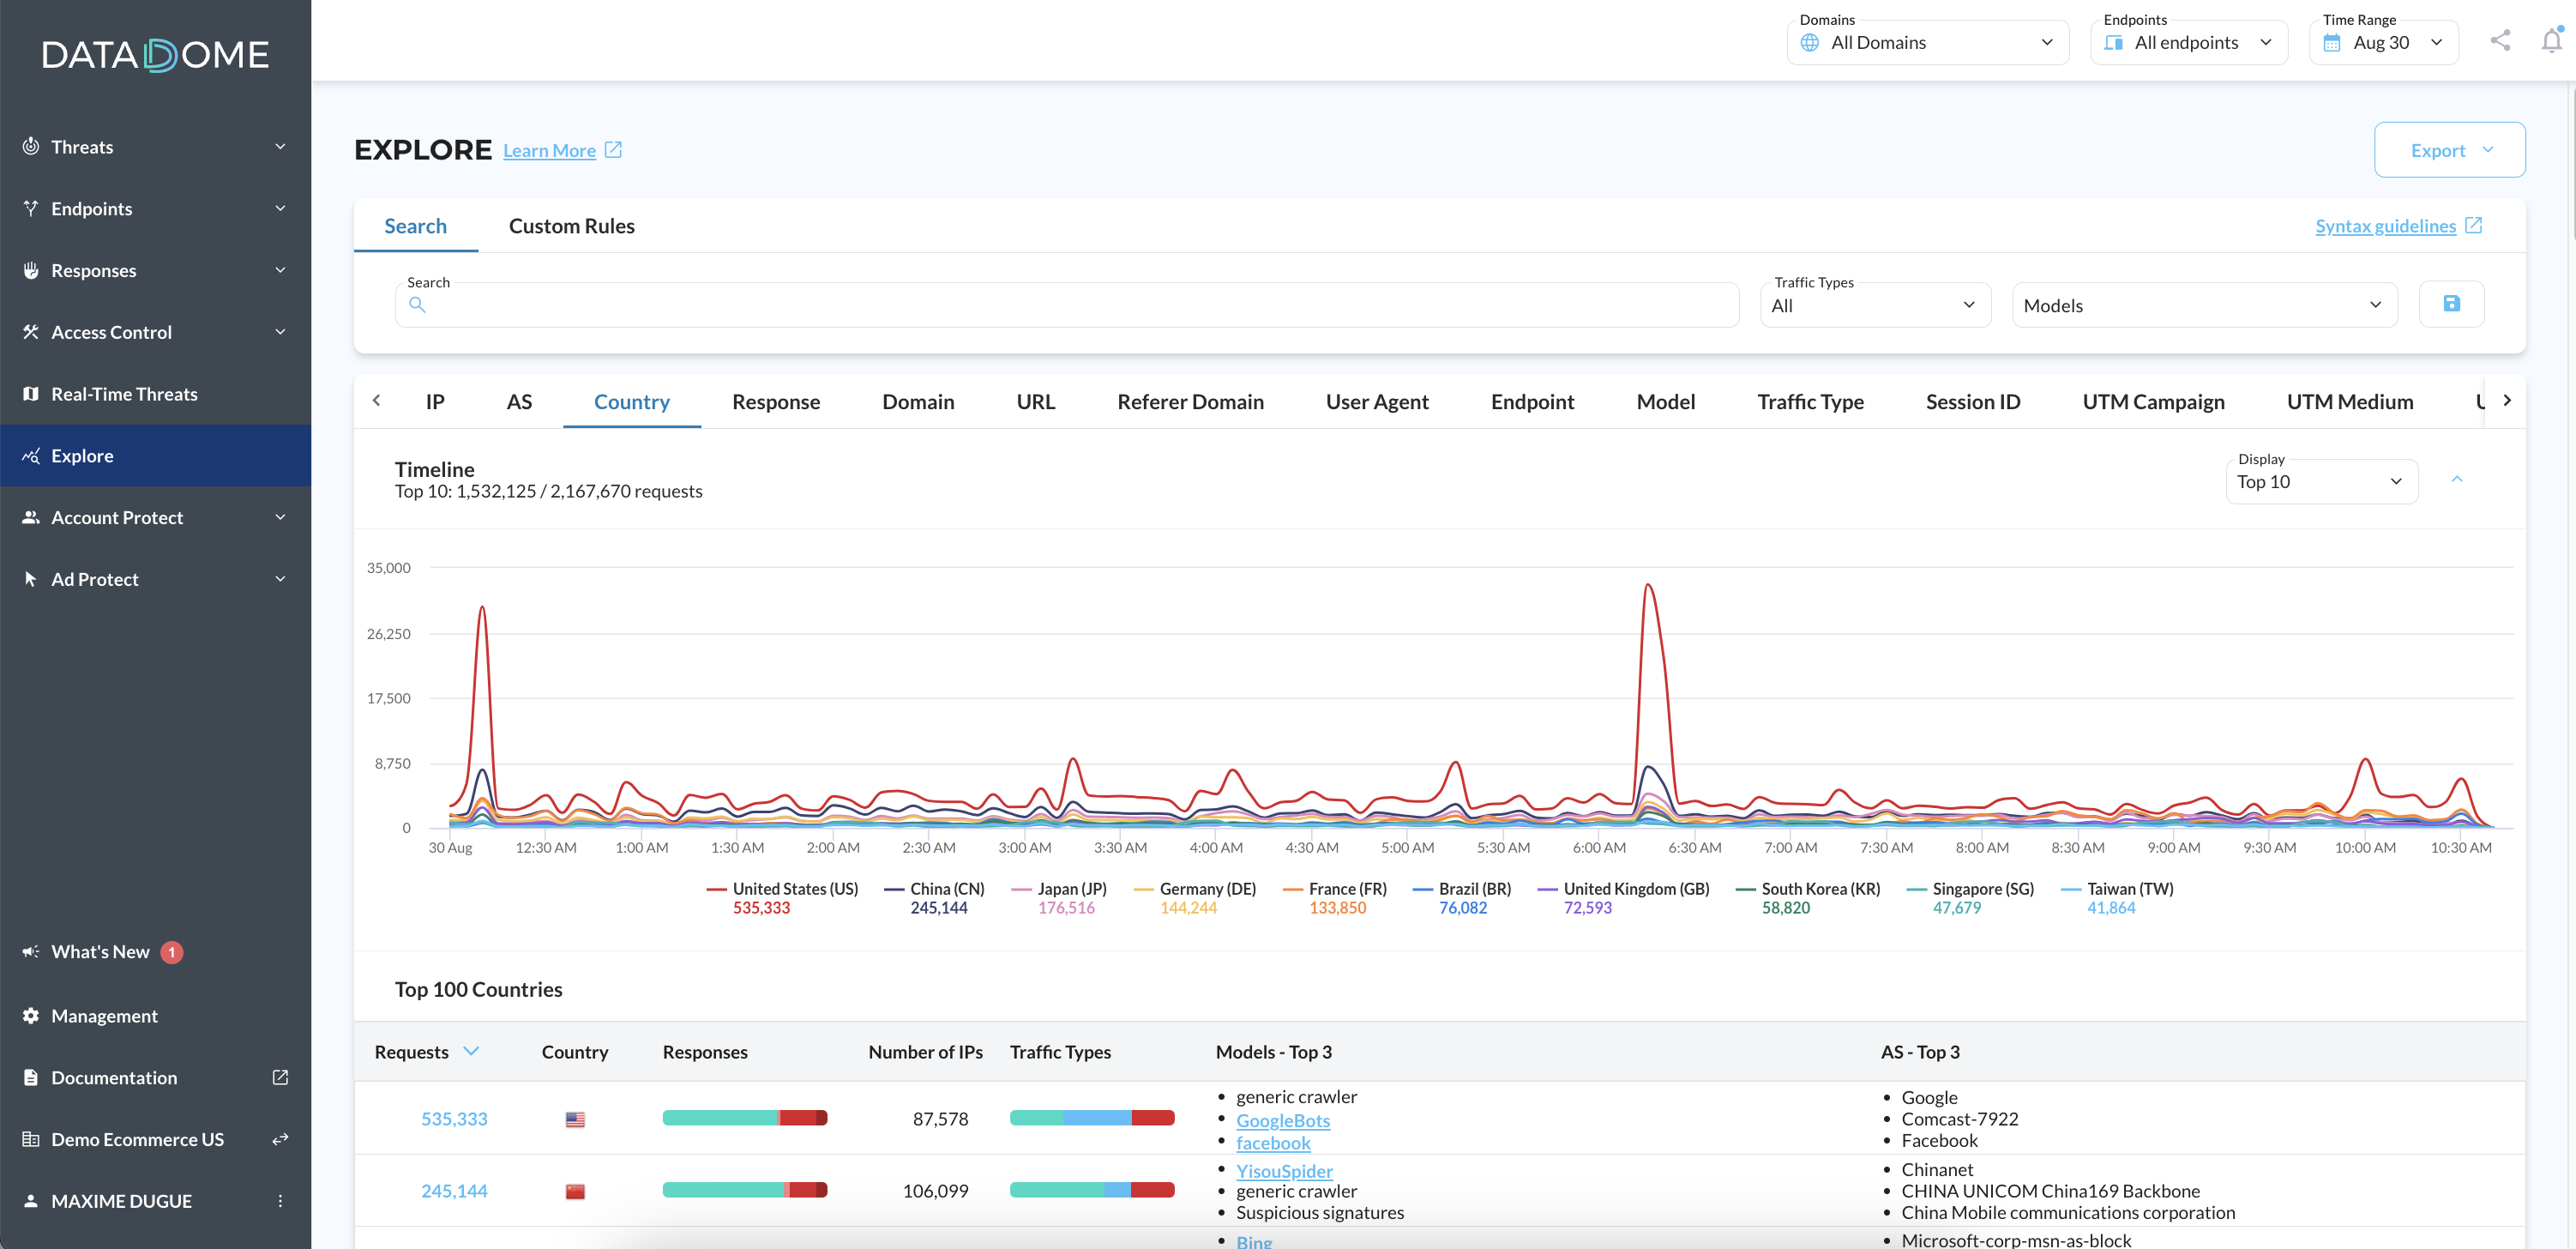
Display "Top 10" view for Country dimension
Thanks to this view, you can analyze your traffic by grouping it along 16 dimensions:
- IP
- AS
- Country
- Responses
- Domain
- URL
- Referer Domain
- User Agent
- Endpoint
- Rule
- Rule type
- Session ID
- UTM Campaign
- UTM Medium
- UTM Source
- Response Status
These dimensions provide you with a better understanding of your traffic with answers to questions such as: which bots are the most active, which domain is the most attacked, which URLs are most targeted by bots, bot distribution by endpoints, etc.
Filters
In addition to the global filters (Time Range, Domains, and Endpoints), the Explore section allows you to filter traffic by Traffic Types and Models.
Traffic Types
Use the Traffic Types filter to select one or more of the following categories:
- AI Threat Detection – Traffic identified as AI-driven threats
- Verified Bots – Known legitimate bots
- Custom Rules – Traffic matching your custom rule configurations
- Human – Legitimate human users
- Uncategorized – Traffic for which DataDome detection was deactivated
Models
The Models filter allows you to view traffic matching specific detection models, including:
- Verified Bots
- AI Agents
- AI Threat Detection models
- Custom Rules
When you uncheck a value in the Models filter, only traffic matching at least one of the remaining checked models will be displayed. This means human traffic and uncategorized traffic (where detection was deactivated) will be excluded from the results.
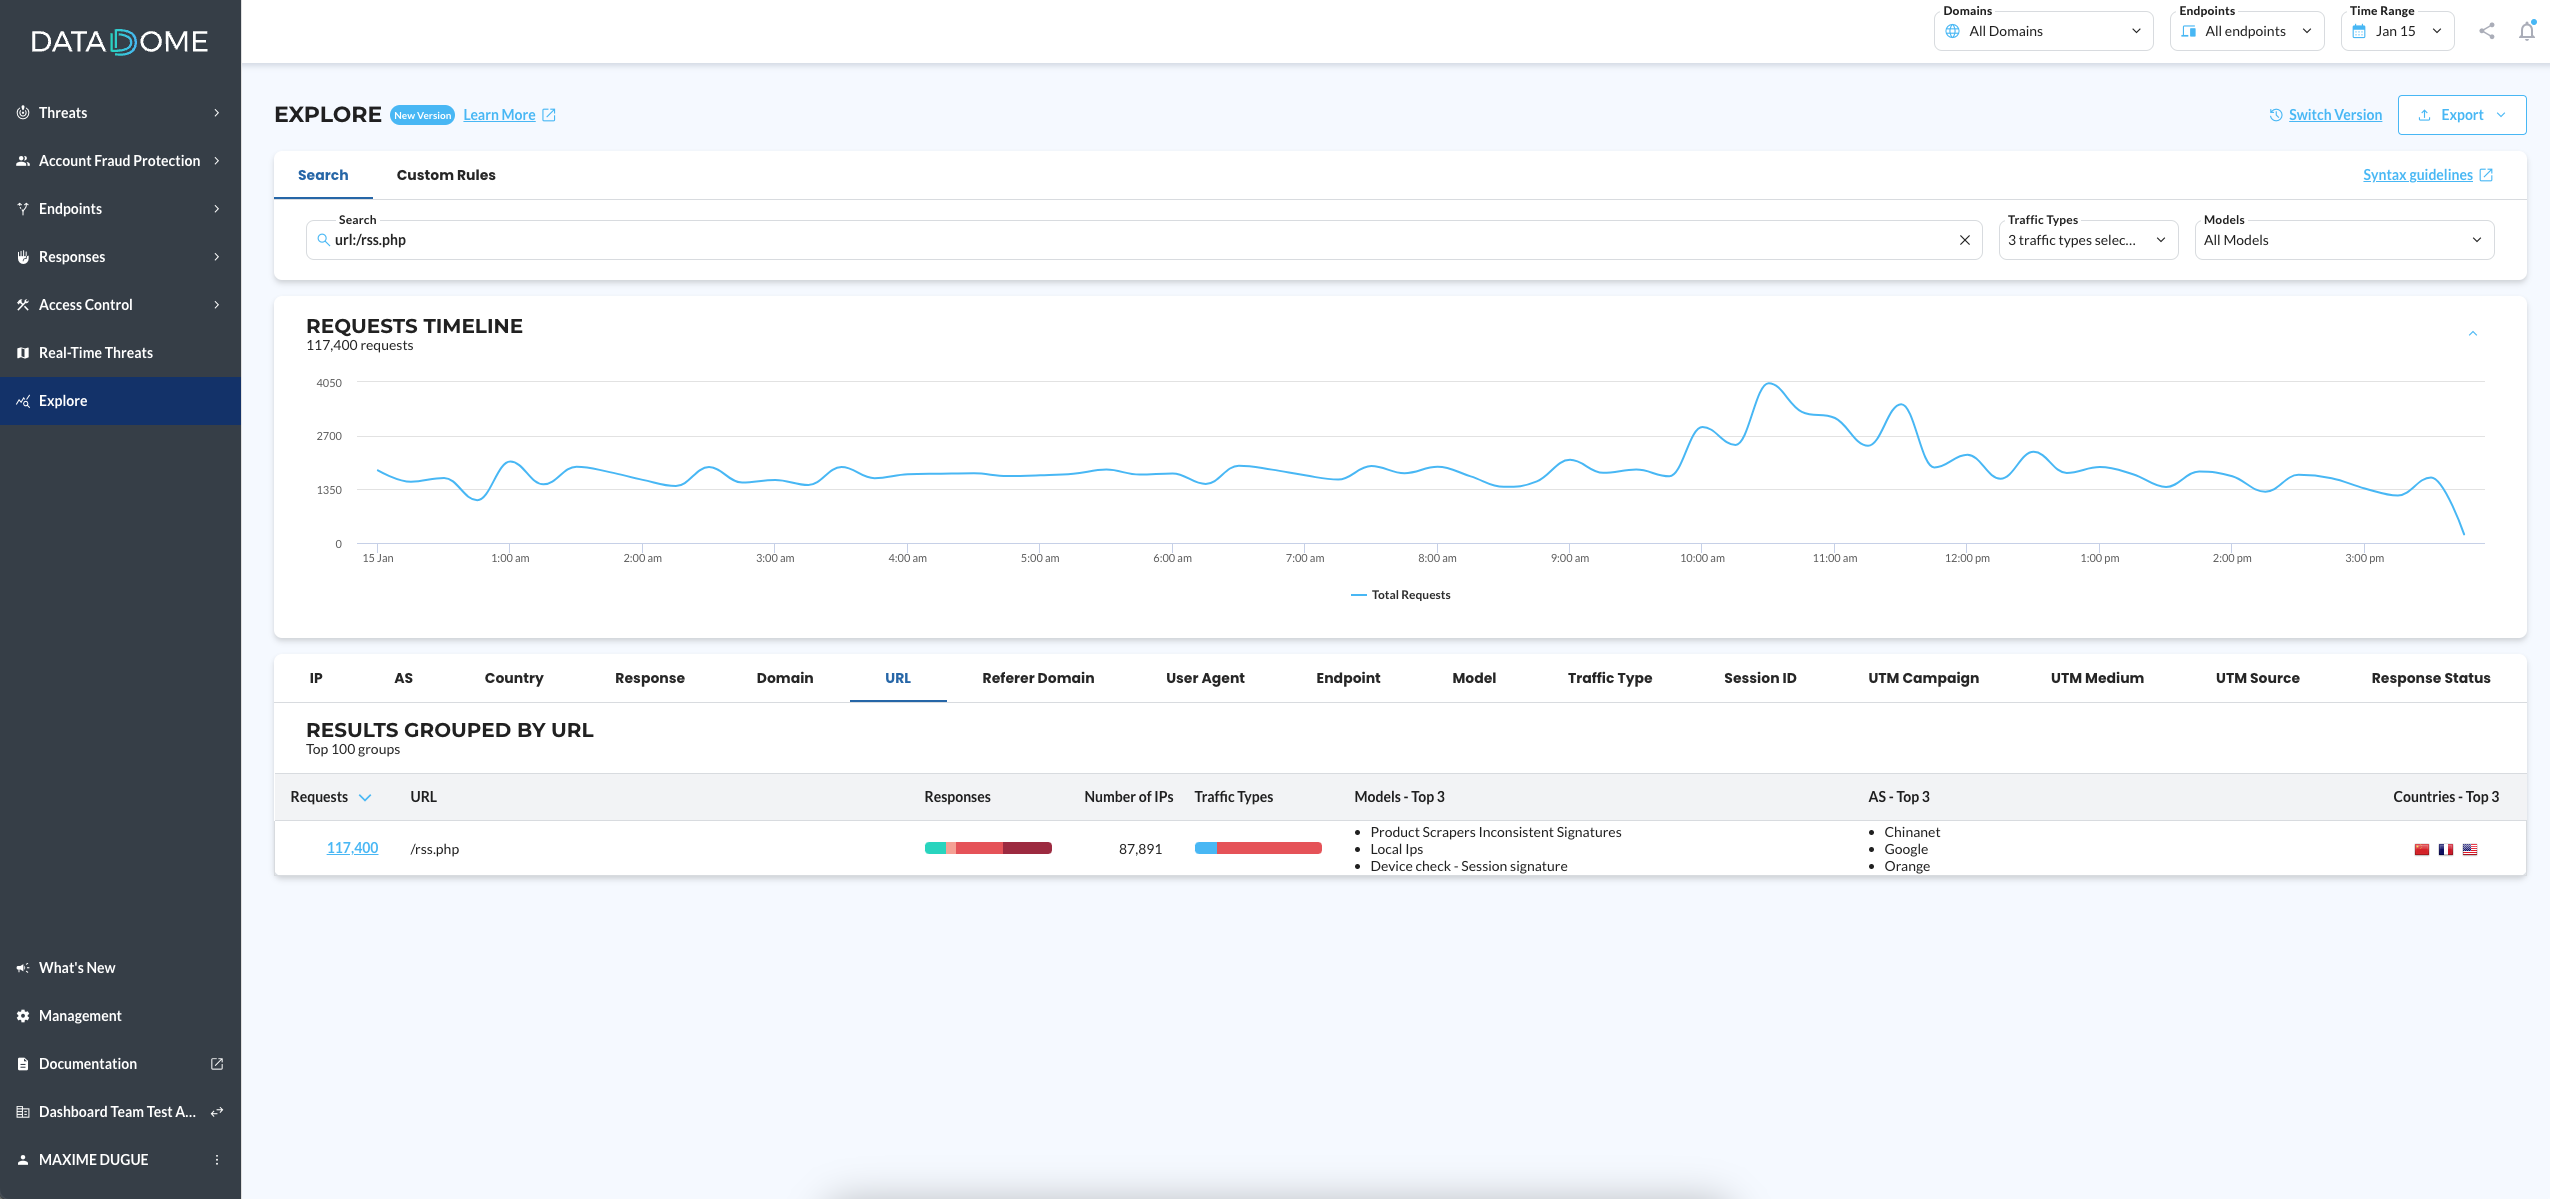
Search
You can search using DataDome DSL to narrow your focus.
Learn more about our DataDome DSL.
Save Dashboard
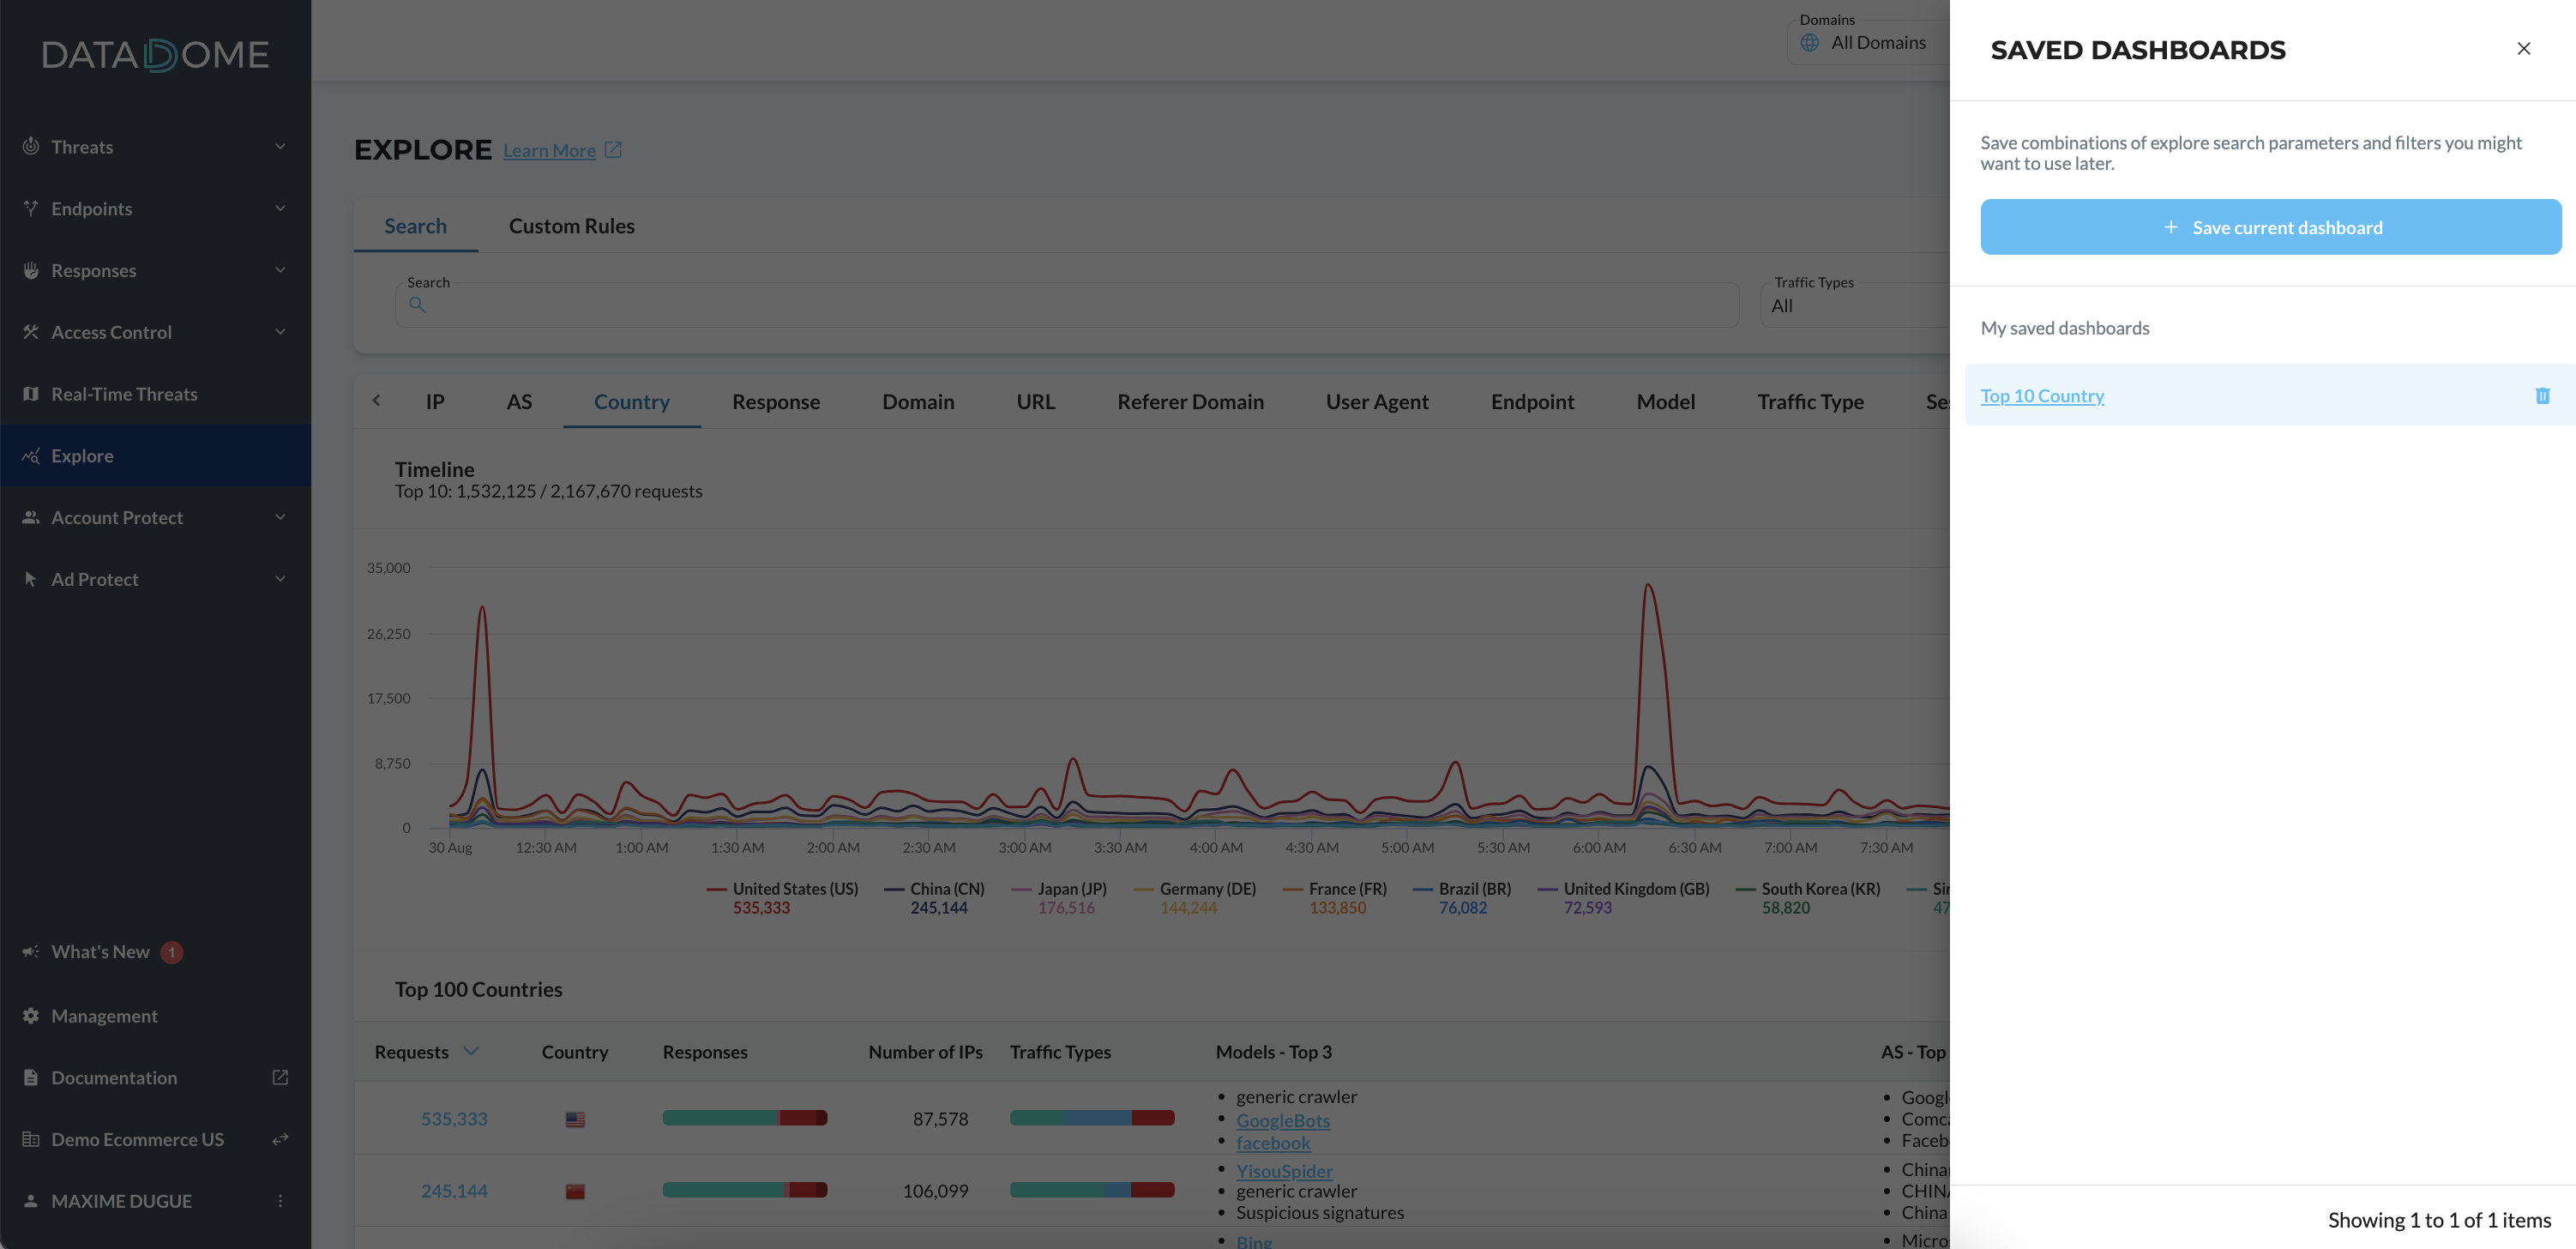
The Save Dashboard feature allows you to save the search query, the filters you choose, and the date/time to open it later.
By default all save dashboards are shared within your workspace
Activity timeline

Request details
Only the first 100 groups of requests are displayed here.

Last requests
To display the last requests, click on the requests' number.
The view provides you with the details about the last 100 requests for the selected value:
- Date
- URL
- User Agent
- Rule Name
- IP
- Response
Scrolling down loads more requests, up to 1000.

Clicking on a request provides you with access to all of its details, including:
- HTTP-related information
- Headers
- Request Enrichment (AS, country, reverse DNS, geolocation, etc..)
- Endpoint
- DataDome Detection
- Response (code and format)

Updated 5 months ago