Get started with your Dashboard
DataDome dashboard for customers
The DataDome dashboard allows you to get traffic information for your websites that are protected by the DataDome module.
- At your very first use of the DataDome dashboard, it may not contain any data yet. Please start by initially Setting up your DataDome module.
Threat Overview
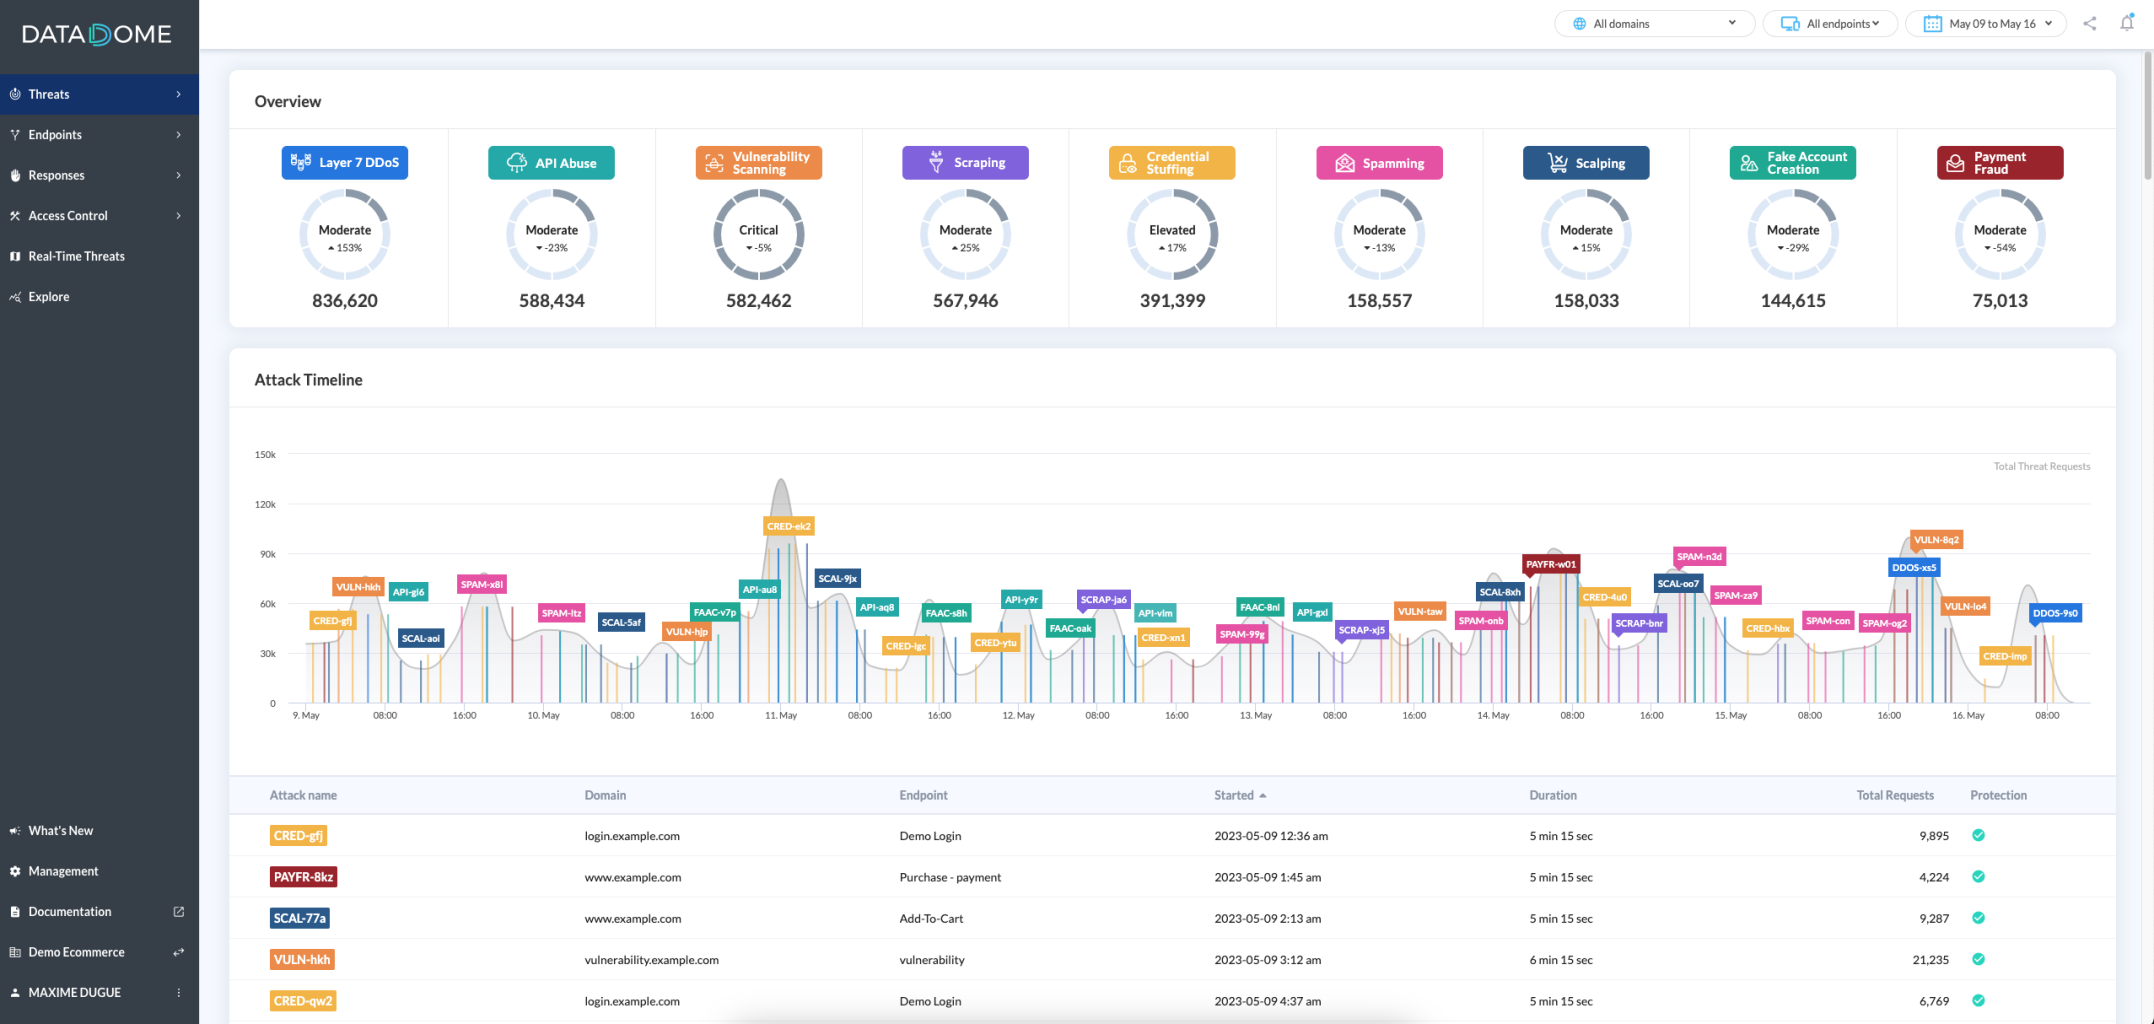
On the home page, the overview will display all the current threats monitored on your websites with the number of associated requests and risk levels.
Below, the timeline chart will let you know all the past or on-going attacks targeting your mobile applications, websites and APIs, over the line chart of total threat requests.

Risks levelsThese levels are computed by watching the volume of your threat requests in comparison to the average threats traffic we see on all our customers. All the risks levels from the lowest to the highest:
- Moderate
- Elevated
- High
- Critical
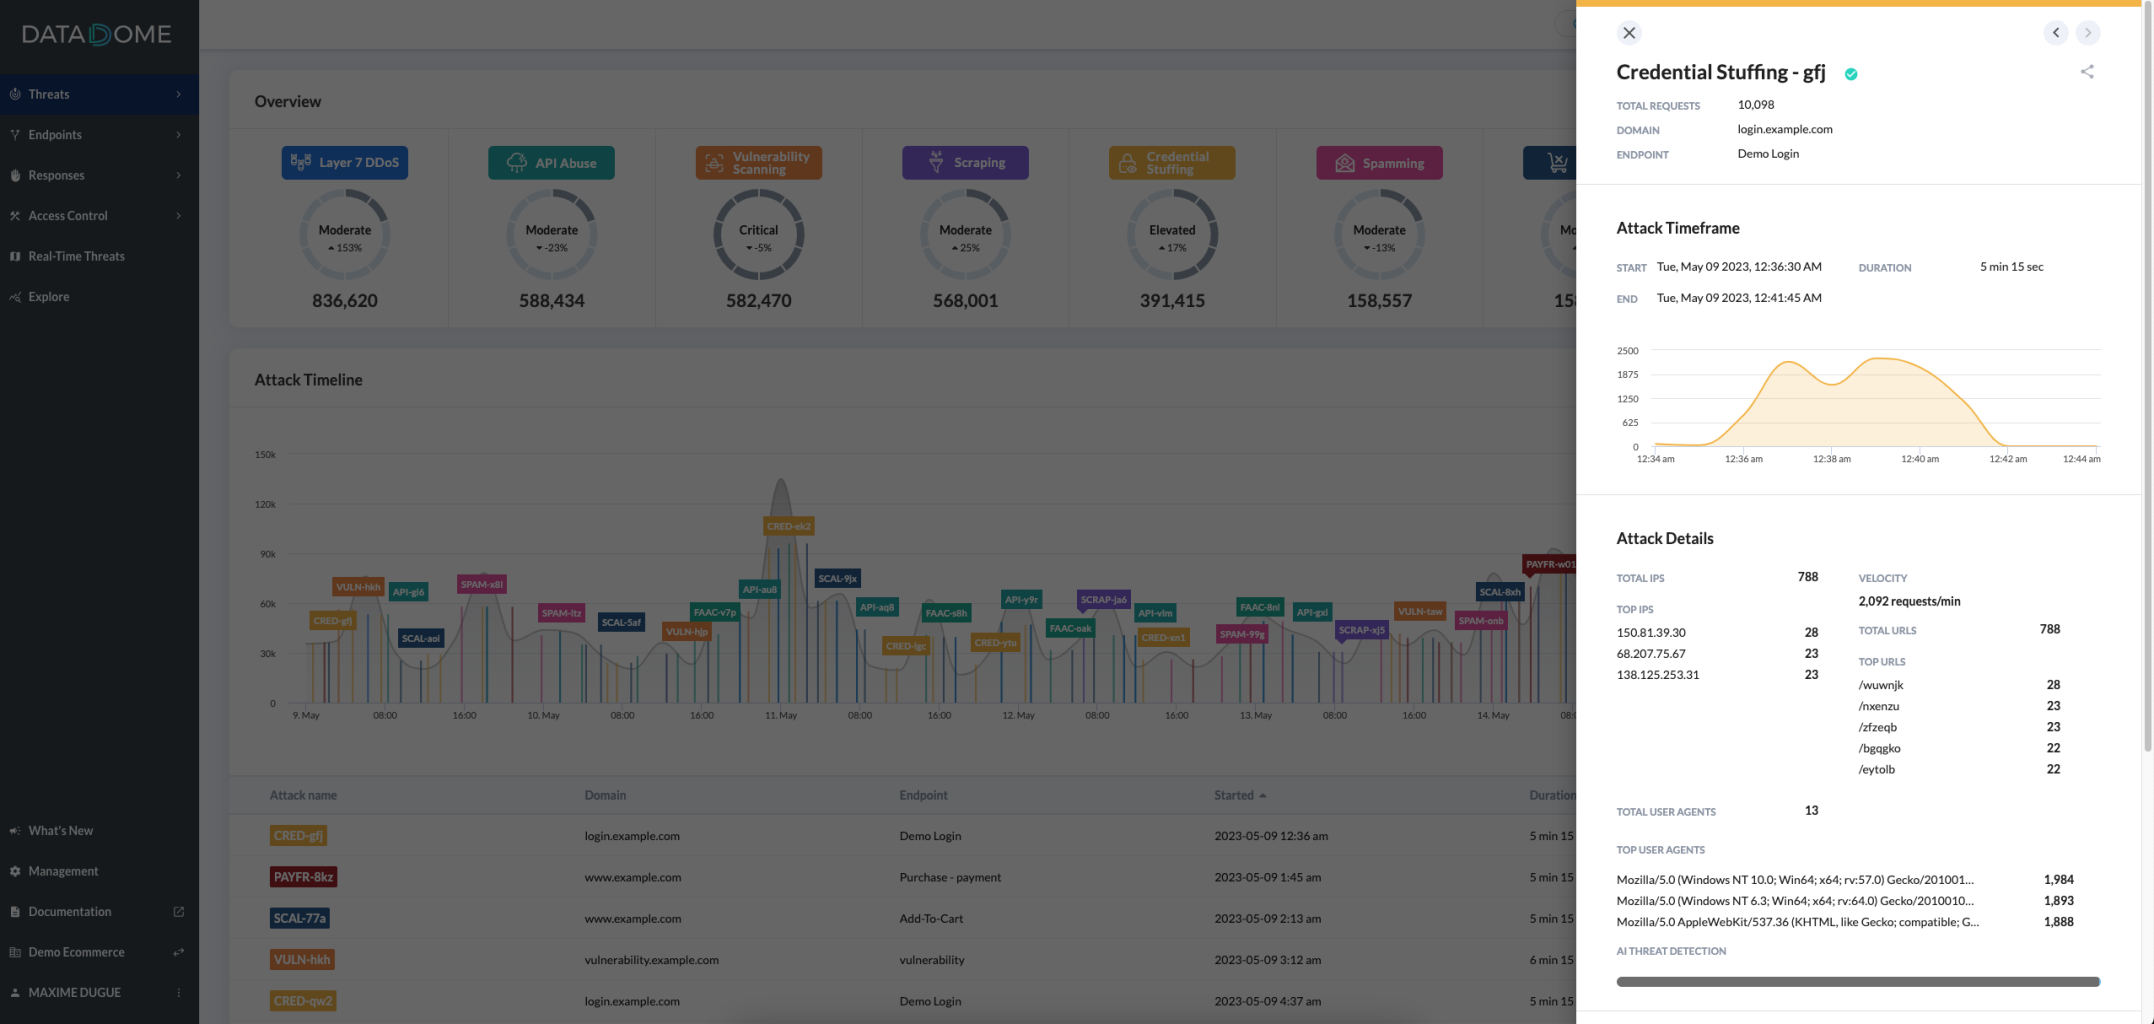
To learn more about one attack, just click on it on the chart or in the tab and it will open the statistics panel. If you want to get in-depth analytics about this attack, just hit the Explore button at the bottom of the panel.

Attack definitionAn Attack highlights a sudden acceleration in the threat requests compared to the regular average threat requests.
An extremely intense attack could trigger the anti-DDoS protection and be classified as DDoS attack.
Attack severityEvery attack is characterized by its severity (high, mid or low), which depends on the attack intensity and volume, compared to the traffic usually observed. You can filter the displayed attacks by severity.
Threat Definitions
Layer 7 DDoS
Requests targeting application/database servers' resources or individual user accounts, to conduct denial of service attacks (DoS).
The activity may resemble a legitimate application's process but leads to the exhaustion of resources such as file system, memory, processes, threads, CPU, as well as human and/or financial resources.
Source: OWASP DDoS Threat Definition.
Vulnerability Scanning
Requests that systematically tally, catalog, and examine identifiable, predictable, and unknown content locations, paths, file names, and parameters, in order to find weaknesses and possible security vulnerabilities.
Source: OWASP Vulnerability Scanning Threat Definition.
Scraping
Requests collecting application content and/or other data for use elsewhere.
Some scraping may use fake or compromised accounts or may exploit information that is accessible without authentication.
Source: OWASP Scraping Threat Definition.
Credential stuffing
Requests conducting mass log-in attempts to verify the validity of stolen username/password pairs or identifying valid login credentials by trying different values for usernames/passwords.
Source: OWASP Credential stuffing Threat Definition.
Fake Account Creation
Create multiple accounts to take action on a website or app.
Source: OWASP Fake Account Creation Threat Definition
Payment Fraud
Verify the validity of stolen payment card data or guessing a missing part by trying different values or using stolen validated payment card data to buy goods online.
This threat includes 3 different OWASP definitions:
Source: OWASP Carding Threat Definition
Source: OWASP Card Cracking Threat Definition
Source: OWASP Cashing Out Threat Definition
Scalping
Buying limited availability goods or services with unfair methods to beat normal users to obtain them.
Source: OWASP Scalping Threat Definition
Spamming
Adding malicious content that will appear on a website or app.
Source: OWASP Spamming Threat Definition
API Abuse
Gain access to sensitive data or system resources through APIs.
Source:OWASP API Security Project
Threat Overview sub-pages
Depending on which threats are monitored on your mobile applications, websites and APIs, you may see on your Dashboard one or more sub-pages from the following list:
- Scraping
- Layer 7 DDoS
- Vulnerability Scanning
- Credential Stuffing
- Fake Account Creation
- Payment Fraud
- Scalping
- Spamming
- API Abuse
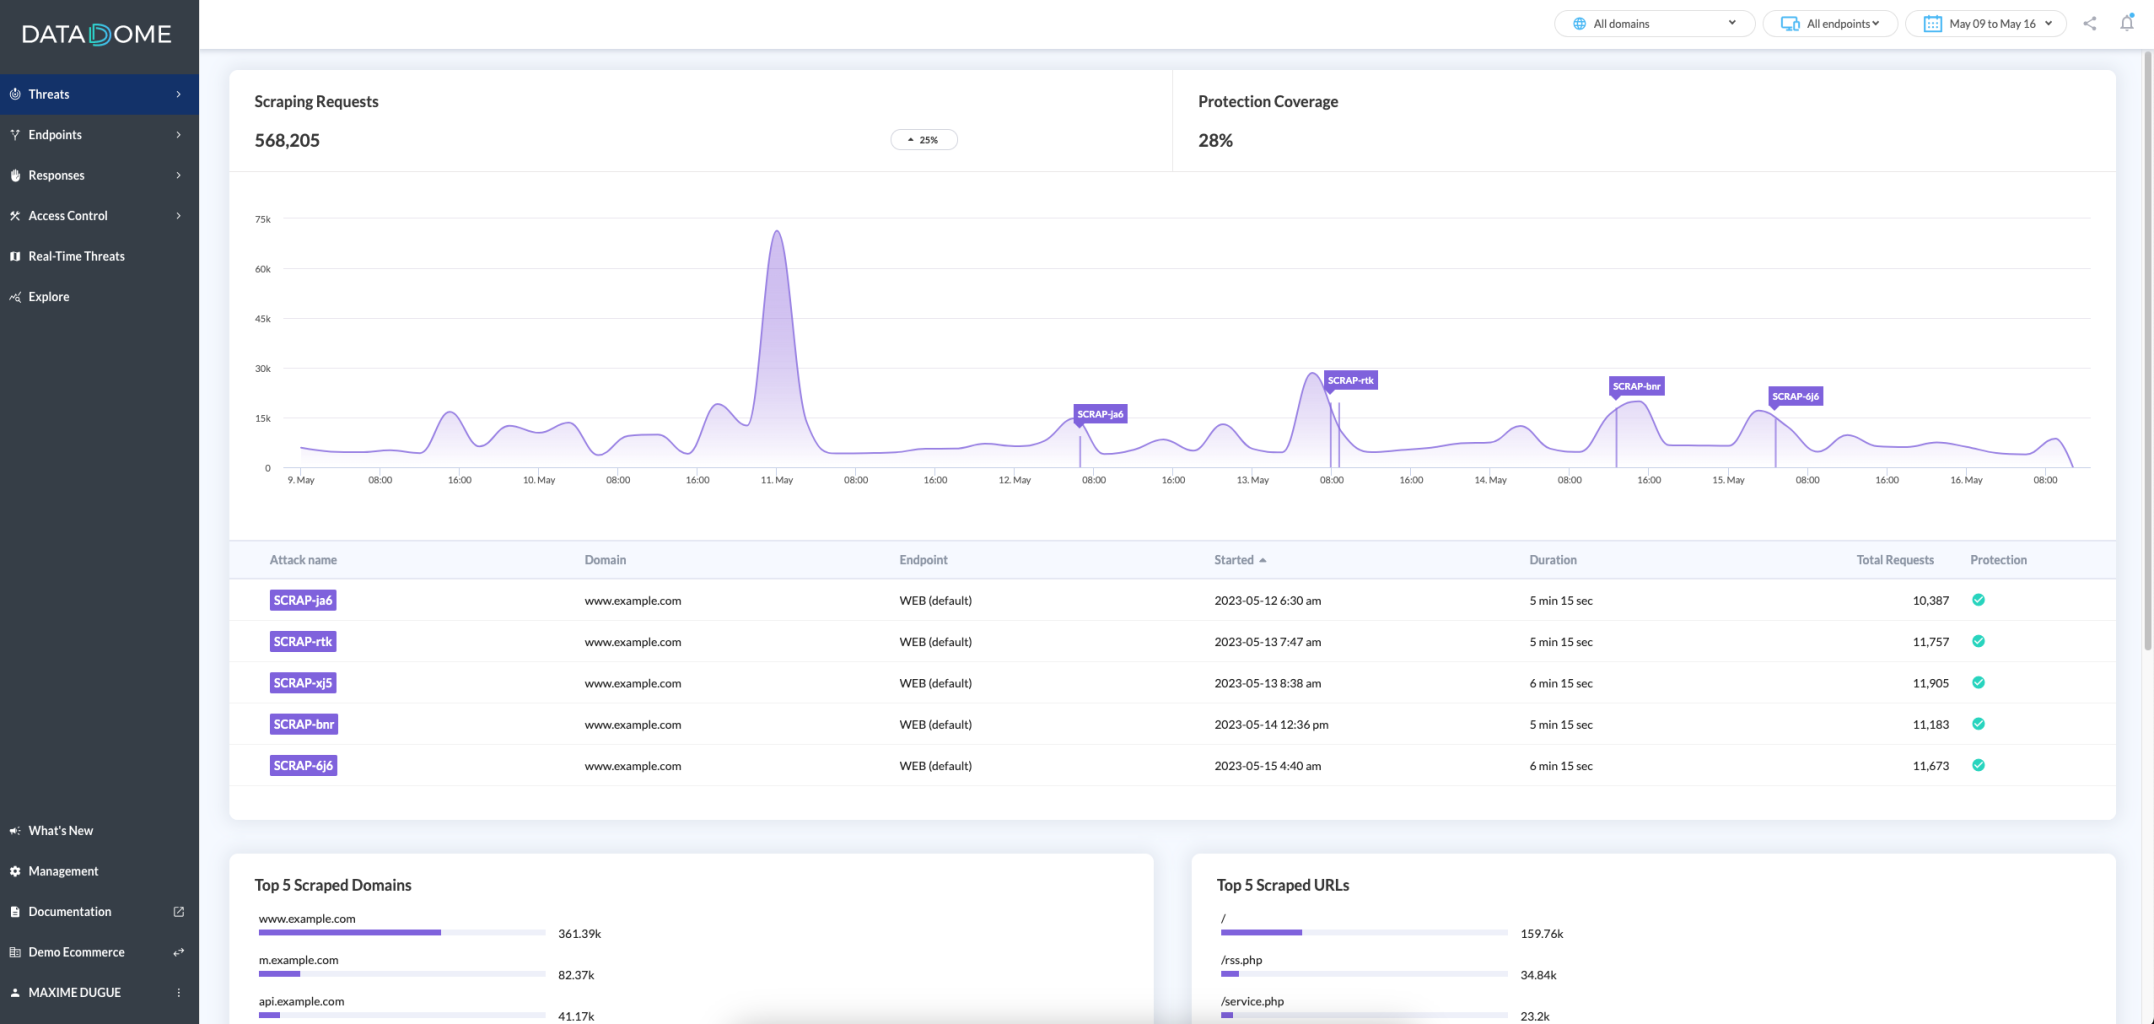
Every sub-page focuses on a particular threat. For example, in the Scraping sub-page, you will find only Scraping requests and Scraping attacks, along with KPIs relative to this particular threat.
Protection coverageIf your protection coverage is not 100%, it may indicate that something is wrong in your endpoint configuration.

Explore
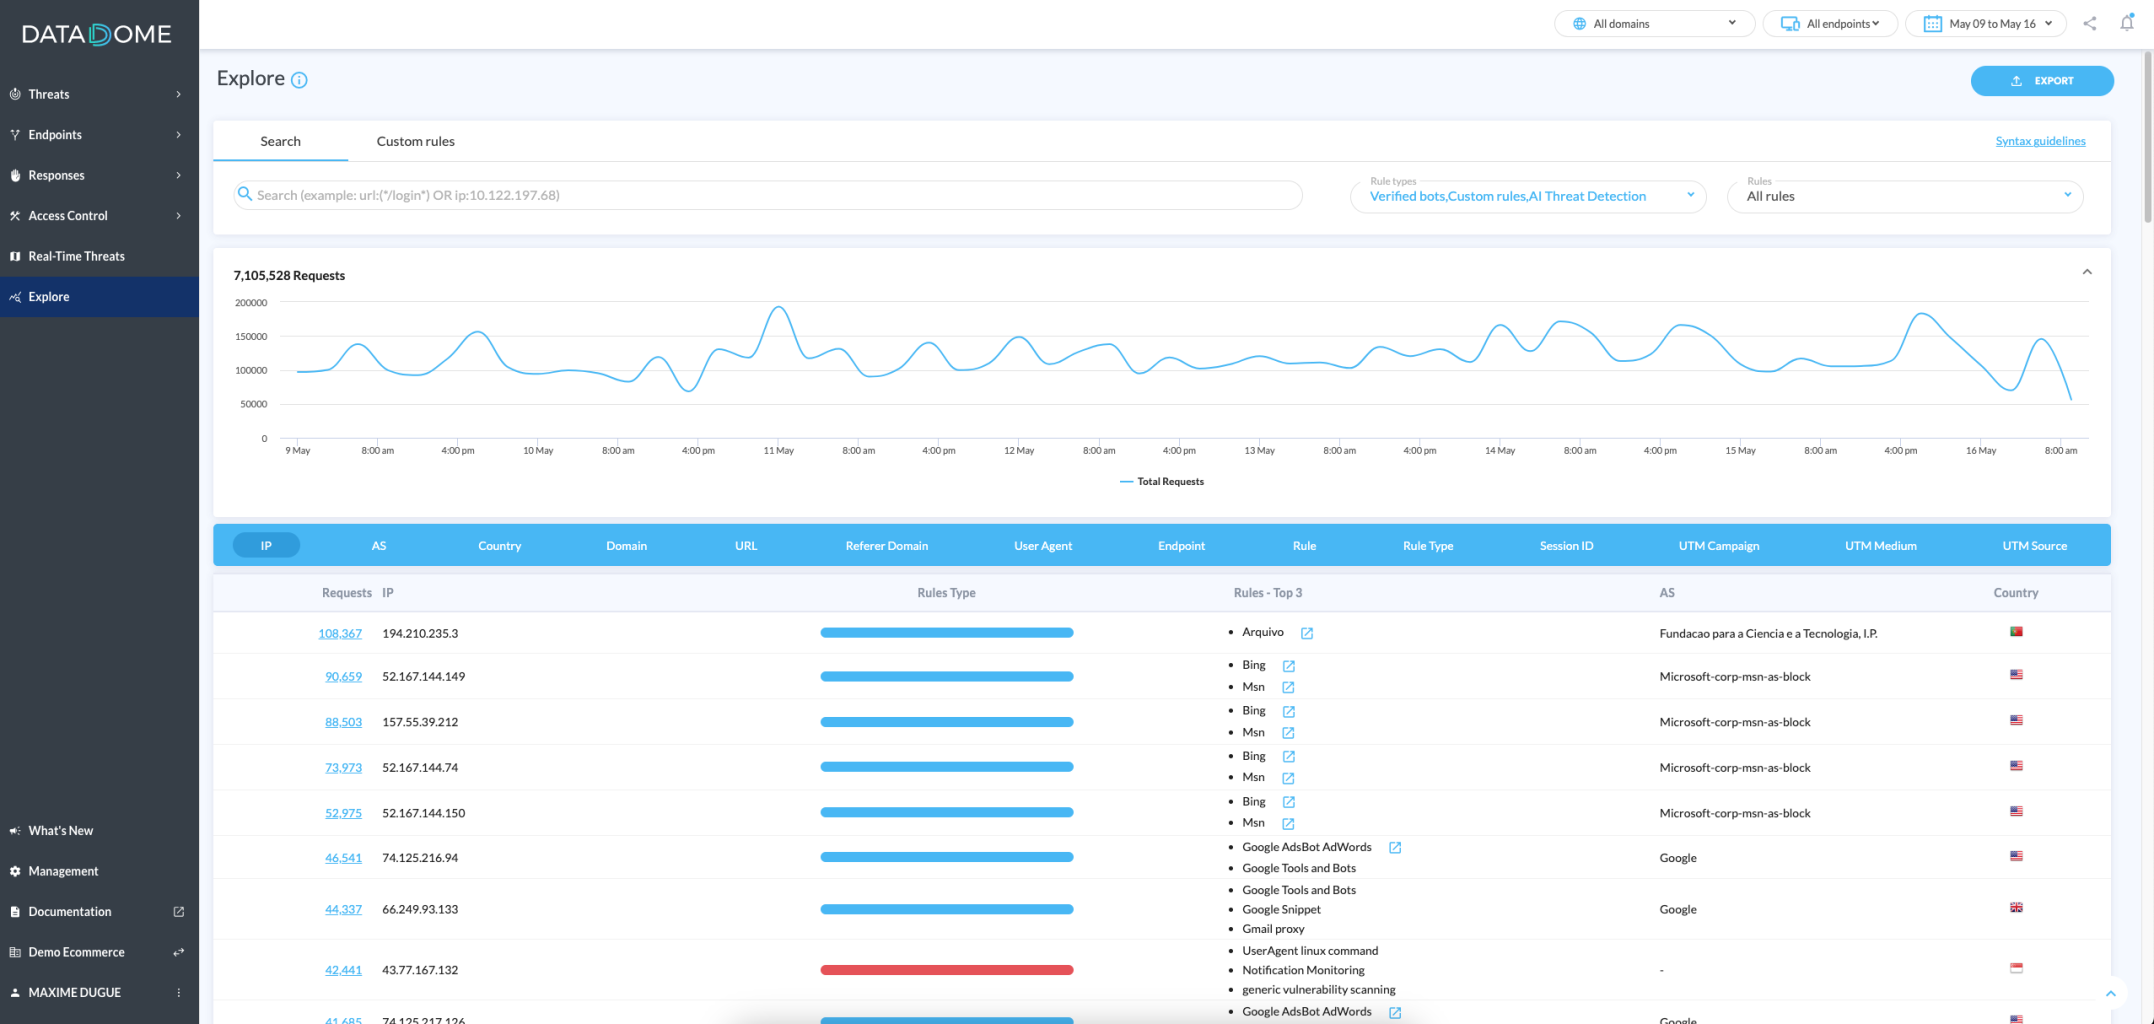
This page allows you to explore traffic by dimension (IP, country, URL, etc.) as well as rules and rules' type. (Read more about explore your traffic).

Updated 8 days ago
