Explore your Account data
The "Explore" view allows you to dig deep inside your data.
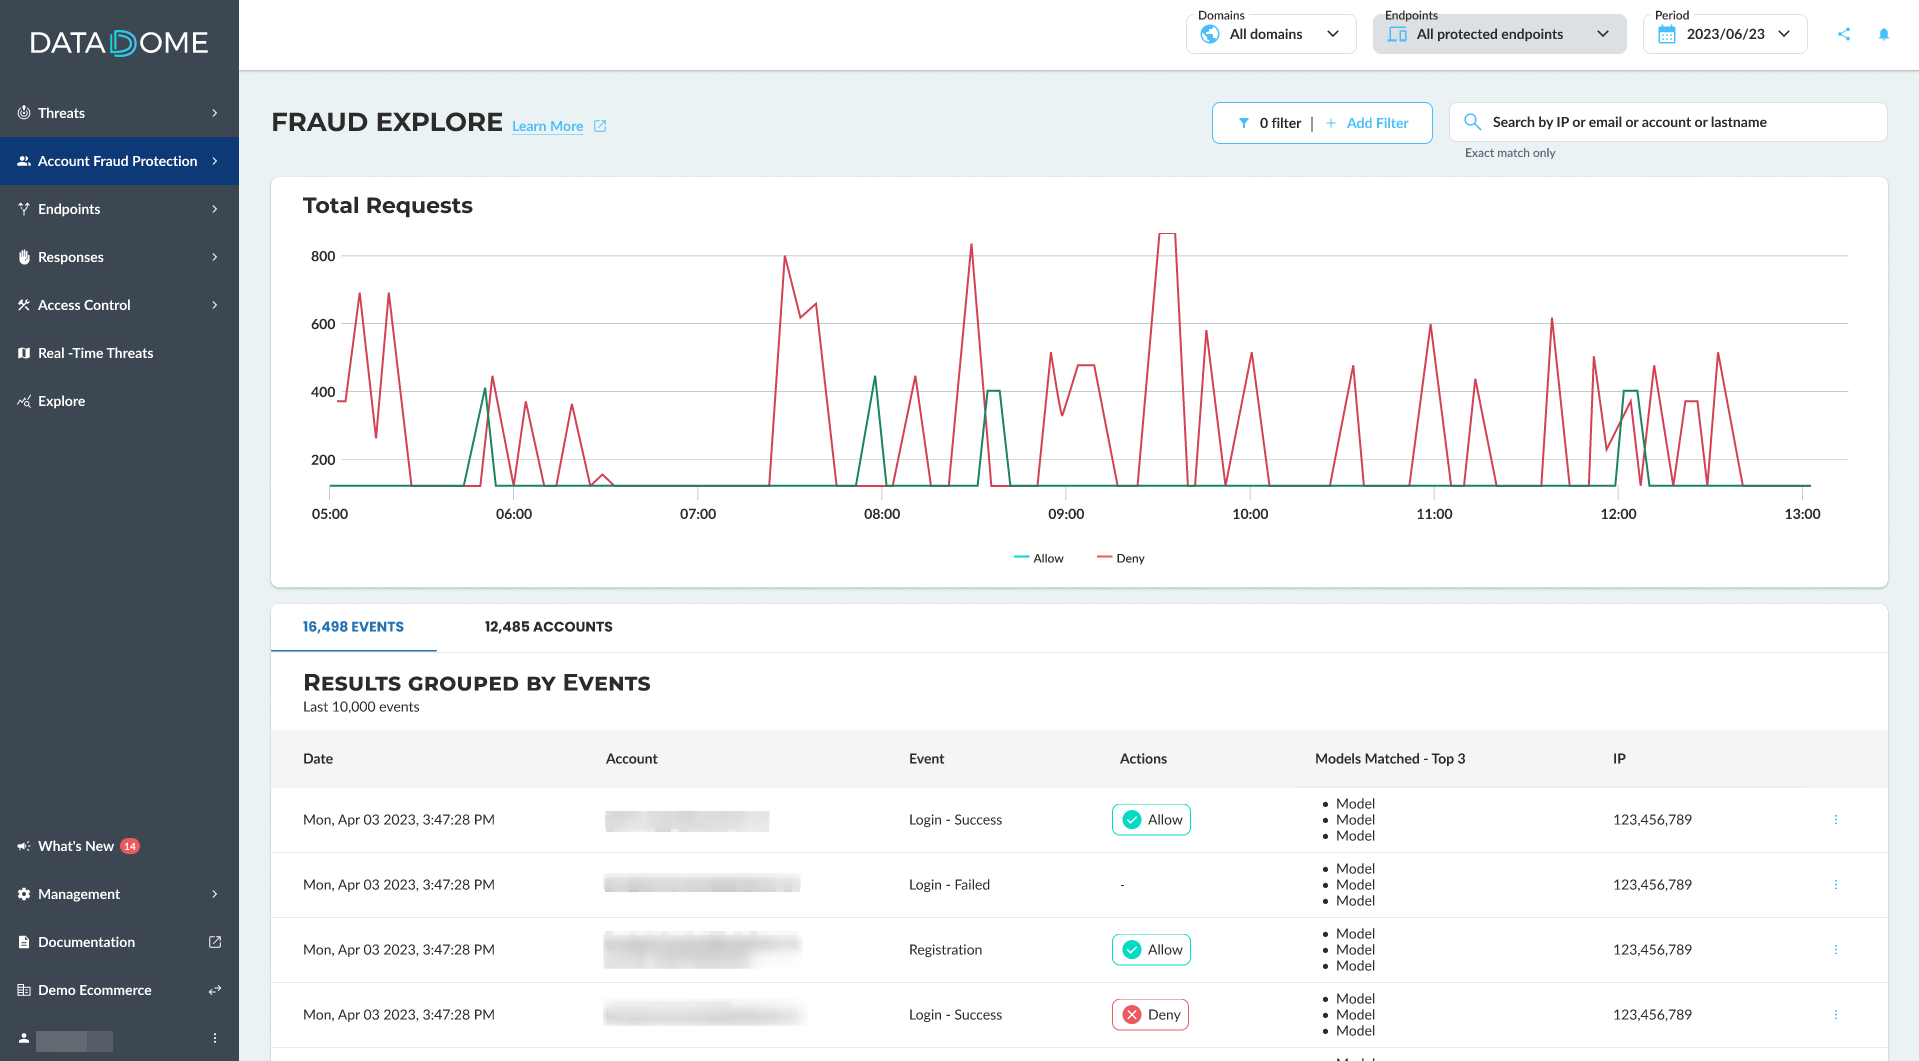
Thanks to this view, you can analyze your traffic by grouping it along 2 dimensions:
- List of Event
- Event group by account
These dimensions provide you with a better understanding of your events with answers to questions such as: which users are the most active, event distribution over time.
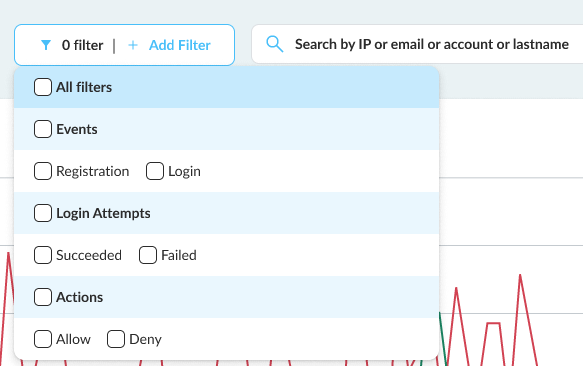
Search
You can filter event display using criteria like IP, email, account or last name.
Activity timeline
You can check the activity for the last 6 months.
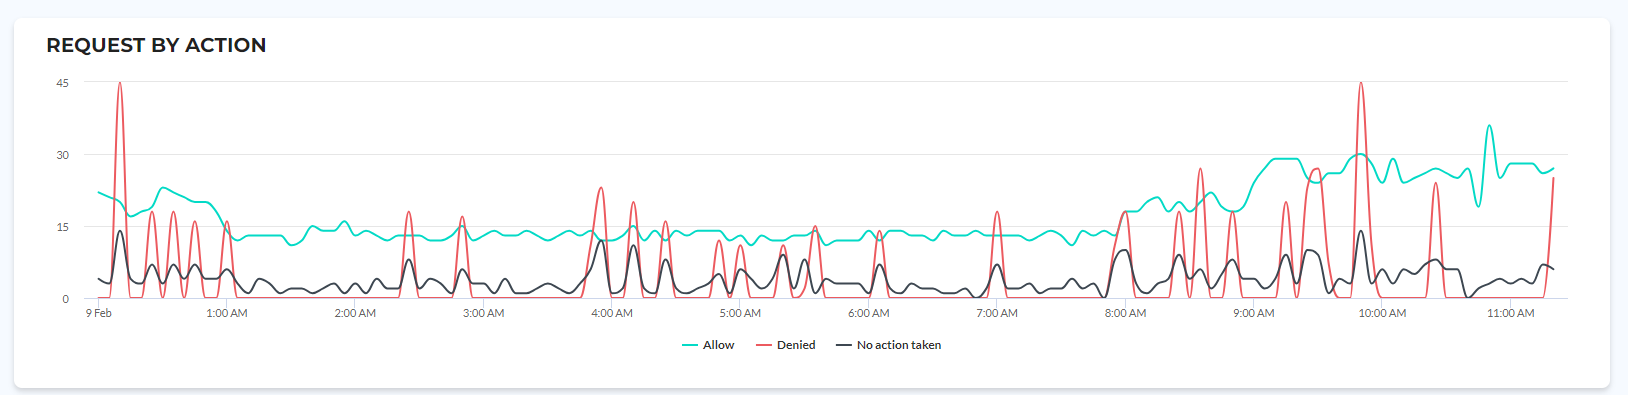
Timelines definition:
- Allow: Show the number of events with an Allow action recommended by DataDome models.
- Denied: Show the number of events with a Deny action recommended by DataDome models.
- No action taken: Show the number of events provided from
Collectmethod. In such case no action is recommended. The data is used to train DataDome model's.- Most often these events were already denied by your application before it was sent to Account Protect.
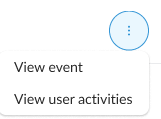
Need more detail?
To display the last event generated by one user or the detail of an event, click on the action button:
Updated 9 months ago
Did this page help you?