Analyze responses
DisclaimerIf you're searching about how to customize the rule responses or response definition please go on this page.
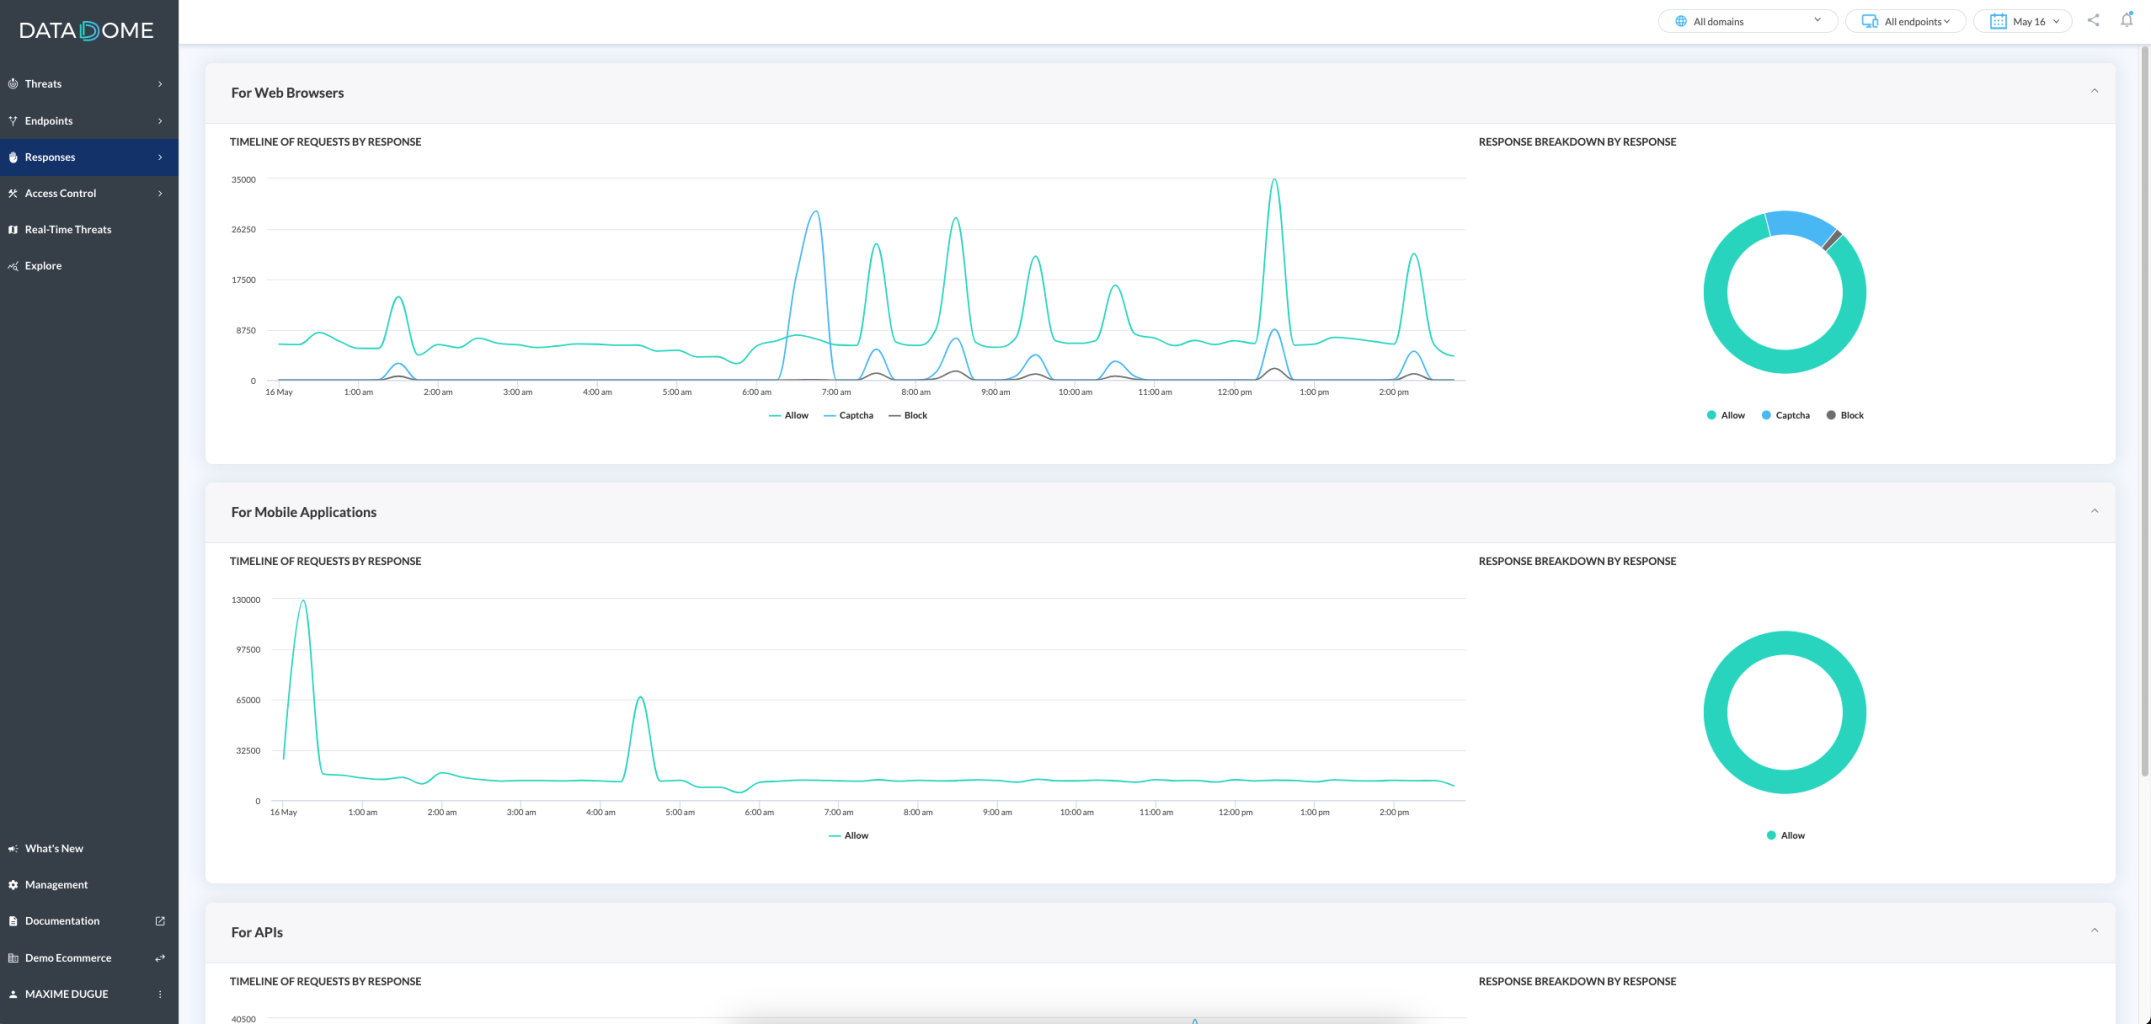
Response section homepage
On the response homepage, the response requests are shown as a timeline chart organized by different endpoint sources.
For example, the first timeline chart show all the responses sent for requests coming from the endpoint source Web Browser.
Response section homepage
Response section subpages
You will find a subpage per response type with different KPIs relative to the response.
For example, for the Captcha response, you will have access to many details around the Captcha flows.
If one of your domain is not using DataDome Captcha, you won't be capable of seeing all these metrics on this given domain and on the 'All domains' settings of the top-filter.
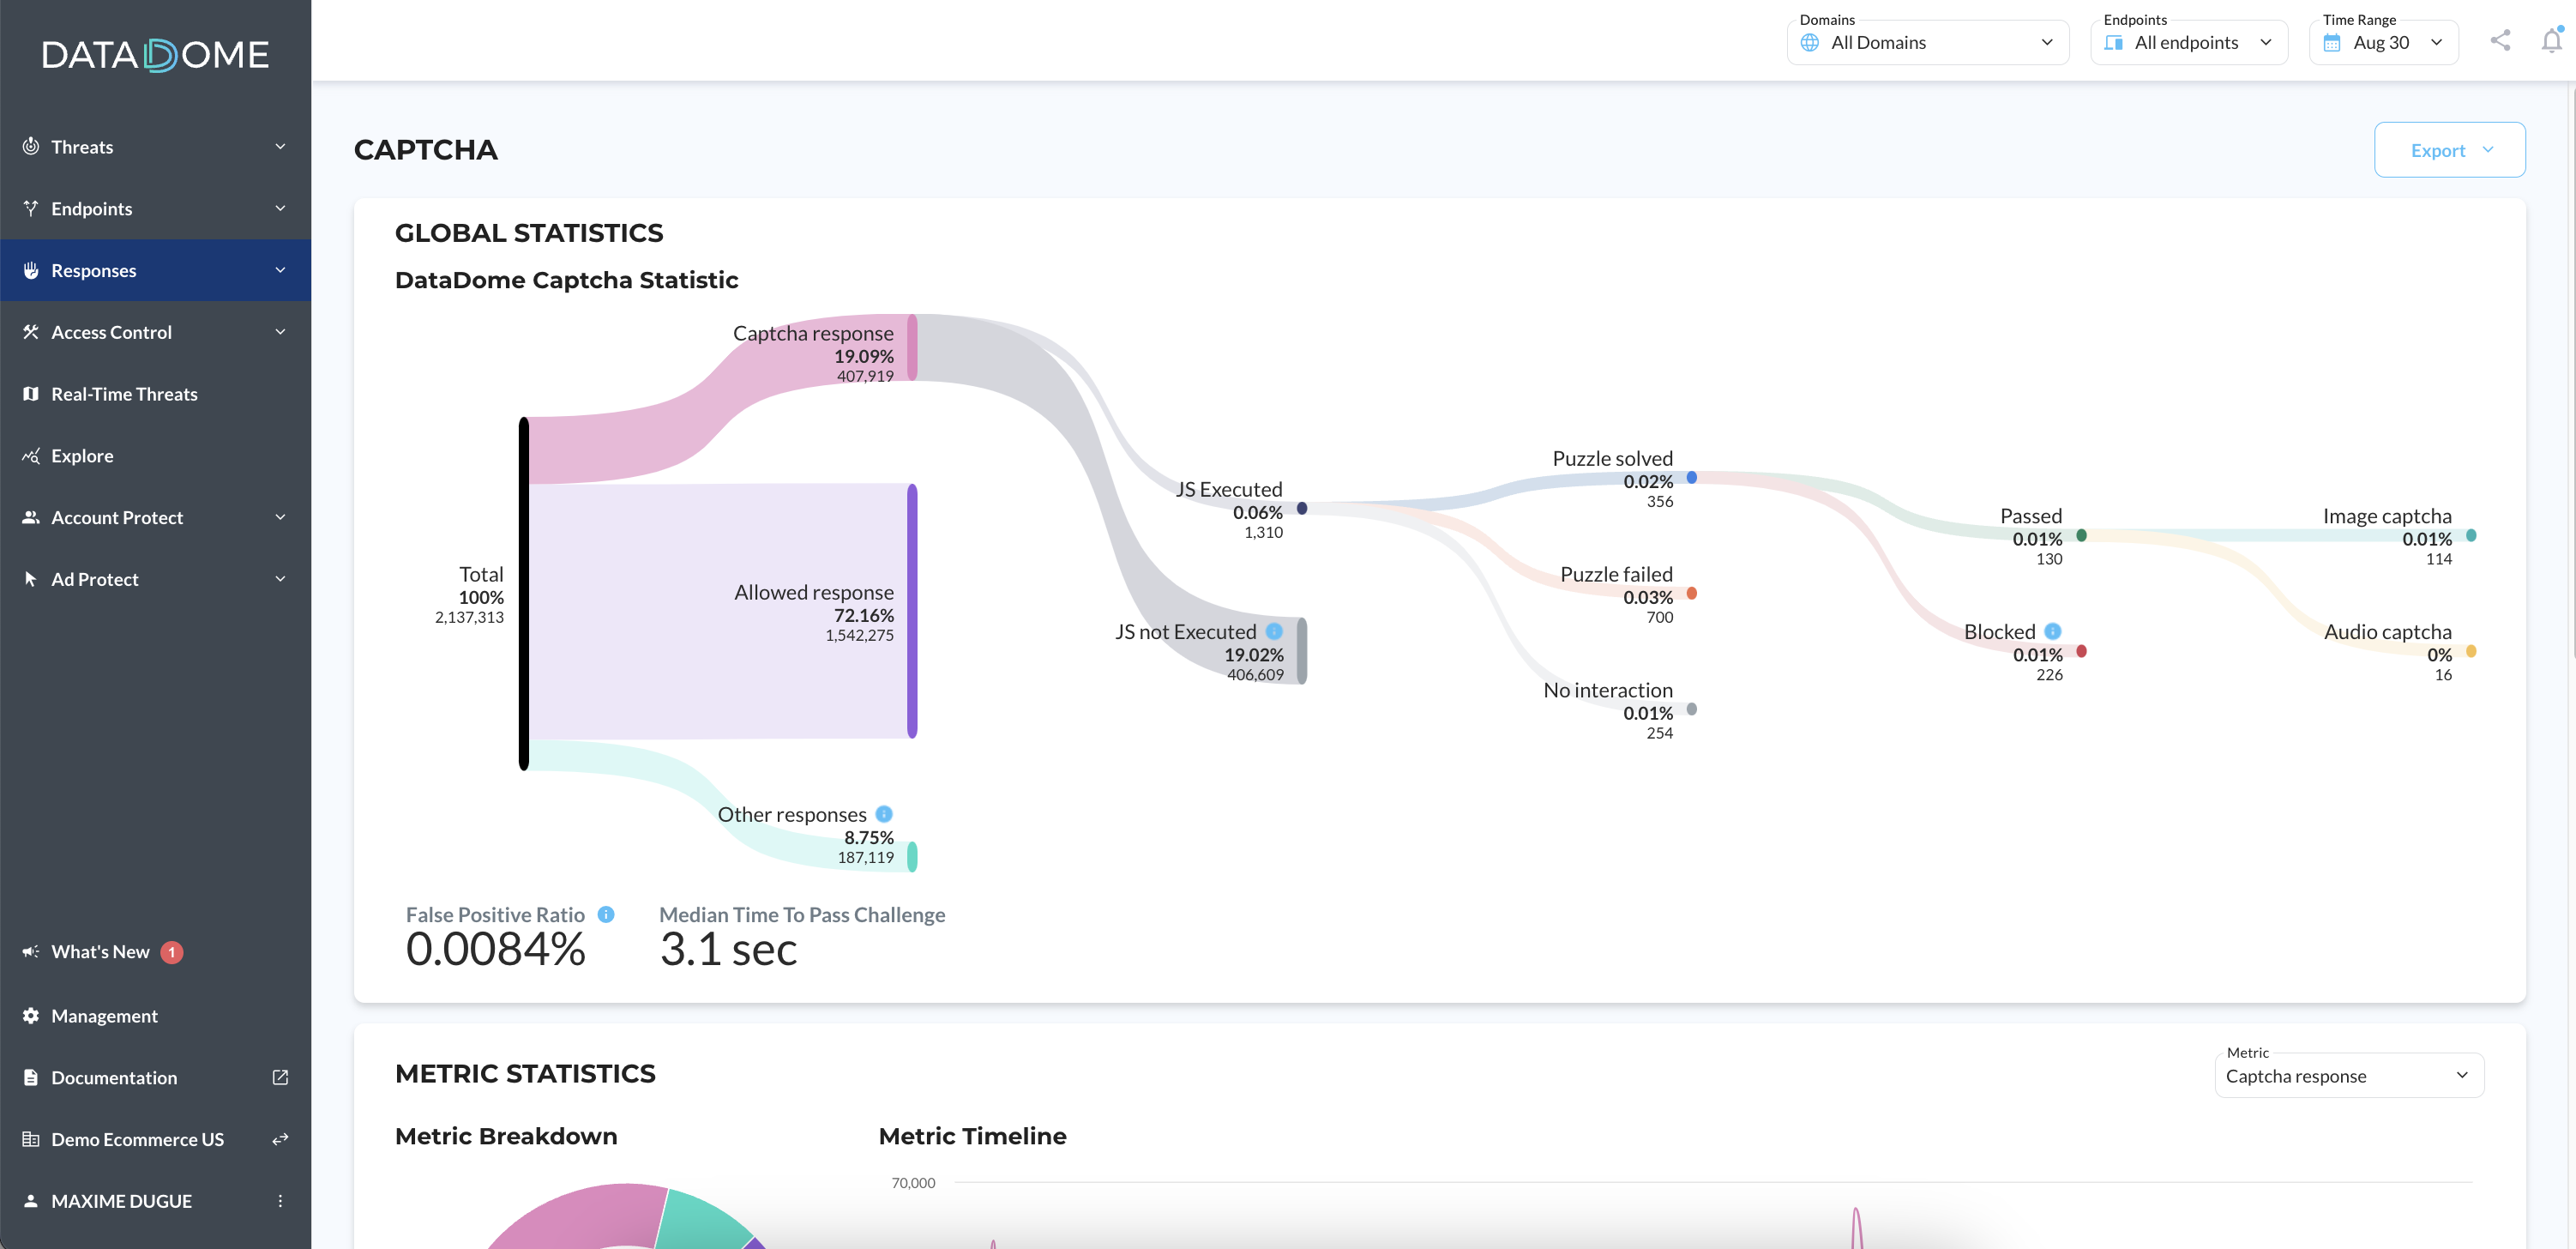
| Metric name | Definition |
|---|---|
| Allowed Response | All requests that have been allowed |
| Captcha Response | All requests where a captcha response has been triggered |
| Other Responses | Rate-Limiting, Block, Time-Boxing, Device check |
| JS Executed | When the captcha page has been displayed on the device |
| JS not Executed | When the device didn’t authorize Javascript execution |
| Puzzle Solved | The challenge inside the captcha page has been resolved, either by audio or image |
| Puzzle Failed | The user failed to resolve the challenge |
| No interaction | The challenge remains unresolved, no user interaction |
| Passed | The number of Puzzle Solved minus the Blocked ones |
| Blocked | Captcha Bots (Hu-Bots, Captcha farms,…) that have been blocked on the captcha page itself |
| Image Captcha | When the captcha page contained an image challenge |
| Audio Captcha | When the captcha page contained an audio challenge |
Updated 5 months ago