Protection & Endpoints
Learn how to manage endpoints.
What is an endpoint?
An endpoint has 3 main properties:
- traffic source: it indicates the origin of the traffic directed to the endpoint
- traffic usage: it indicates the functional context of the resources included in the endpoint, to separate different parts of your website and/or mobile app
- name: a name of your choice, to identify the traffic directed to the endpoint in the dashboard
Fine-grained protectionDataDome uses the traffic source and traffic usage parameters to apply the right algorithms and detect specific threats.
Traffic sources
We define the following values for the sources:
| Value | Description |
|---|---|
| Web Browsers | requests coming from all Browsers (mobile or desktop) on websites or APIs |
| Mobile Apps | requests coming from mobile apps (iOS, Android) on APIs |
| APIs | automated requests coming from machine/scripts on APIs |
Traffic usages
We currently propose the following usages:
| Name | Description | Examples | HTTP methods |
|---|---|---|---|
| General | Default endpoint type. All URLs that are not included in another endpoint configuration. | domain.com/ | All |
| Login | Login, account creation or forgot password forms. | domain.com/login domain.com/signup domain.com/forget | All |
| Forms | All URLs with forms, could be password forms, troubleshooting forms etc. Except the Account Creation form. | domain.com/contact domain.com/report domain.com/comments | All |
| Account Creation | All URLs related to the account creation on a website/app | domain.com/signup, domain.com/account/signup | All |
| Cart | All URLs related to the basket in e-commerce website | domain.com/cart, domain.com/add-to-cart | All |
| Payment | All URLs related to the payment processing on e-commerce website/app | domain.com/payment, domain.com/checkout | All |
| RSS | RSS/Atom feeds fetched by a desktop application or an online aggregator. | domain.com/feed.json domain.com/rss.xml | All |
How to manage endpoints?
Deleted endpoint visualizationIf you just deleted an endpoint, you will still be able to see it in the analytics screens of the dashboard if it matched traffic over the past 30 days. After the 30 days period, the corresponding deleted endpoint won't appear anymore on the analytics screens.
Default endpointBy default, one endpoint is pre-set in your account: “Web (default)”.
The endpoint “Web (default)” cannot be reordered or deleted.
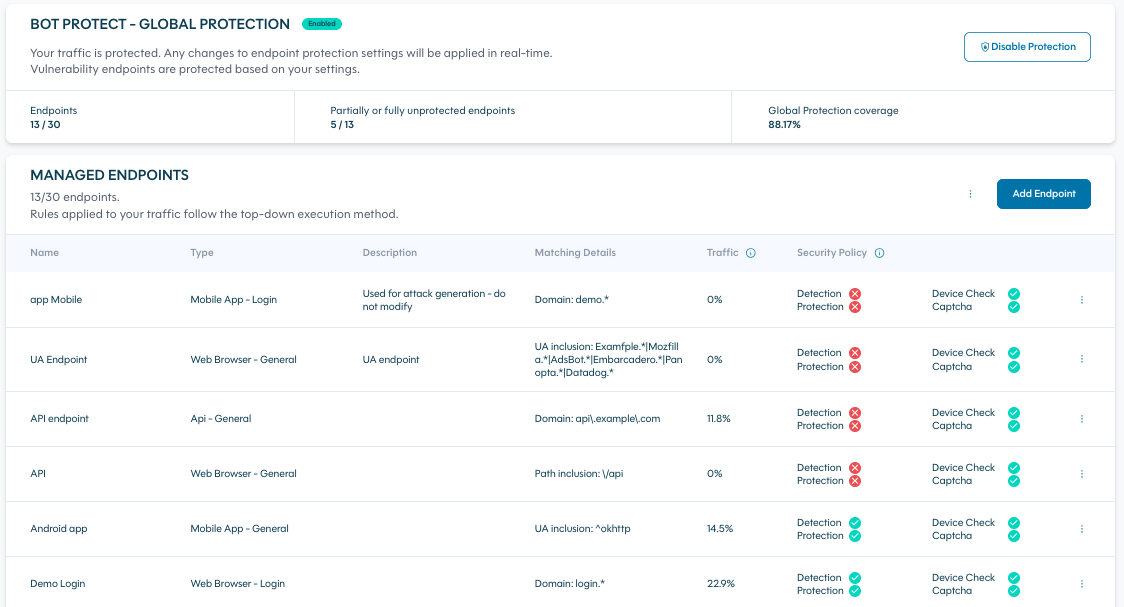
Go to Management > Protection & Endpoints
A list of endpoints connected to your account is displayed.
The endpoints are matched following the top-down order: for a given request, the first matched endpoint is chosen. Changing the order in the list implies a change in the matching priorities.
Admin view
Roles & actions
| Role | Add | Edit | Reorder | Edit security policy |
|---|---|---|---|---|
| Admin | YES | YES | YES | YES |
| Editor | - | - | - | - |
| Viewer | - | - | - | - |
Endpoint set-up
To set-up an endpoint, several pieces of information are requested.
General information
| Field | Mandatory/Optional | Explanation |
|---|---|---|
| Name | Mandatory | A unique label to identify the endpoint |
| Description | Optional | A free text description |
| Traffic source | Mandatory | See Traffic Sources |
| Traffic usage | Mandatory | See Traffic Usages |
| DataDome's cookie SameSite | Mandatory | The value of the "SameSite" attribute set for DataDome's cookie. By default "Lax", it can also be set to "Strict" or "None". |
| Response format | Mandatory | The content type of DataDome response sent to the requester in case of detection (Device Check, Slider or block page). It can be set to "AUTO", "HTML" or "JSON". By default, it is set to "AUTO". |
Traffic identification
Two methods can be used to identify the endpoint traffic. The two methods described below are mutually exclusive: they cannot be used both at the same time for a given endpoint.
1. Traffic query
Traffic matching an endpoint can be defined using a single traffic query. The list of available fields and the syntax guidelines are described in the traffic queries syntax user guide.
Case sensitivityTraffic queries for endpoints definition are matched case-insensitively. You can still use case-sensitive queries in interface for a more accurate preview of the matched traffic.
2. Regex on URL and UA
Traffic matching an endpoint can also be identified defining regex conditions (following the PCRE regular expression syntax) for at least one of the following elements:
- Domain inclusion
- URL path inclusion
- URL path exclusion
- User Agent inclusion
For example, here you can find a pattern of any relevant path for payment:
^(https?:\/\/)?([\w.-]+)\.(\w+)(\/[\w.-]*)*\/(pay|payment|checkout|purchase|order)(\/|$|\?)Security policy
It is possible to control the security policy applied to the traffic reaching the endpoint.
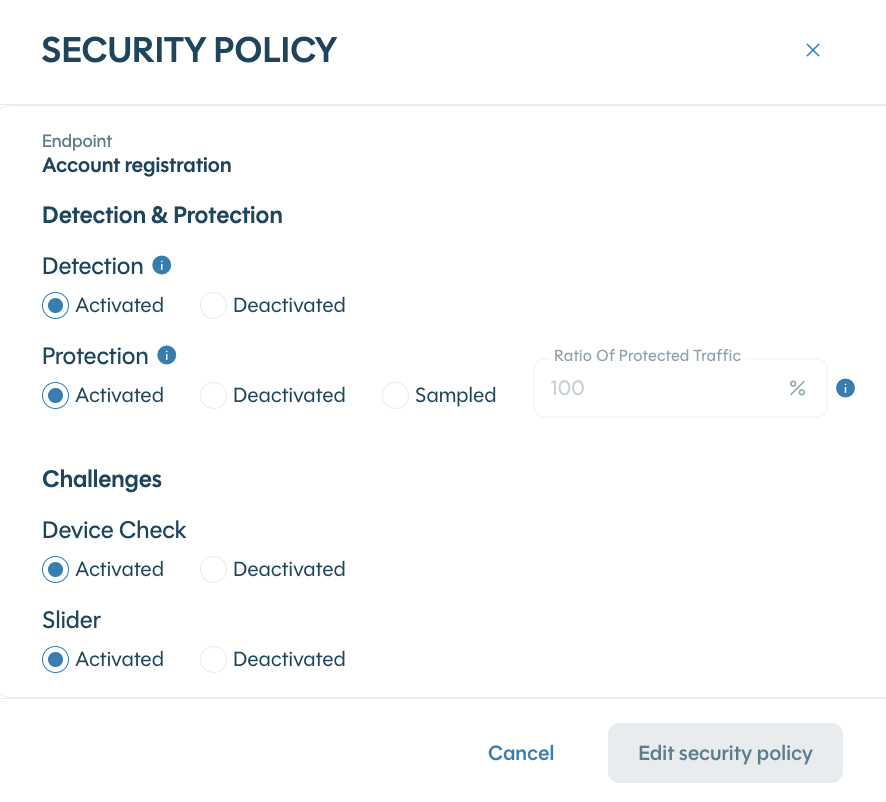
Detection
DataDome detection can be activated or deactivated.
Protection
If detection is activated, DataDome protection can be
- deactivated, i.e. threat traffic is allowed
- activated, i.e. threat traffic is blocked or challenged
- sampled, i.e. protection is only applied on a ratio of incoming traffic, according to a chosen sampling rate
Sampled protectionWhen protection is sampled with a given traffic ratio, the sampling ratio is applied on session IDs. This ensures protection policy remains consistent along sessions, but the actual ratio of protected requests might vary, as the distribution of traffic across sessions is not uniform. For example, setting a sampling ratio to 10% will ensure 10% of the sessions will be protected, but the ultimate protected traffic could be slightly different (likely between 8% and 12%), as some sessions send much more requests than others.
Protected vs unprotected traffic can be filtered in the explore section using the field
protection(adding a filtering conditionprotection:enabledorprotection:disabled) and tracked via the specific enriched headerX-DataDome-protection.
Global protection coverageIt is possible to apply a protection rate to all protected endpoints at once, selecting the option Edit ratio of protected traffic from the Managed Endpoints menu.
Challenges
You can activate or deactivate Slider and Device Check challenges at any time. Both are enabled by default.
When a request matches a model that triggers a deactivated challenge, DataDome's fallback logic automatically applies the next least intrusive challenge. If no other challenges are available, the request is allowed.
Specifically, the fallback hierarchy works as follows:
- Slider deactivated: The system falls back to a Device Check.
- Device Check deactivated: The system allows the request.
Slider-less Device CheckWhen Device Check matches a condition that would normally trigger a Slider challenge, but Slider is deactivated on the endpoint, the request is allowed without any further challenge.
How to analyze traffic?
The percentage of traffic is indicated for each endpoint. It includes normal users & bots and is calculated for the last 20 minutes.
You can analyze the endpoint’s traffic by clicking on Actions > View Traffic Details to display the following information:
- An overview of the last 24 hours with the number of requests, URLs and IPs, the top 2 IP owners, and the top 3 UA.
- The last 100 requests.
You can also analyze through the "Explore" view (Read more about the Explore view.

Updated about 2 months ago